
It’s been a while since the last blog post. We had mentioned
in our last post that we would be taking some time off to prepare the final
stages of making Squared Concept a Registered Investment Advisory firm and I
was personally studying for the CMT level I exam. The good news is that we have
completed all the steps needed in becoming an RIA and I did pass the exam.
We are now a fully operational RIA and have started to take
in external investment assets. Please visit our new website www.squaredconcept.net. We’d like to
take the opportunity to thank everyone for their patience.
Rocky Balboa Market
We have written about several market concerns including slow
and contracting global economic growth, slowing US economic growth, weak
corporate earnings and deteriorating market technicals as reasons for our somewhat
sullen mood. While our views have not changed we are realigning our methods of
approach.
I was flipping through the channels this weekend and the
movie “Rocky” was on. I’ve seen the movie over 100 times it seems and yet I
always end up watching it again when I find it on the tube. It occurred to me
that this stock market is like Rocky, takes a beating but against all odds it
keeps coming back. How many times over the past several months have short
sellers believed that knock-out blow had been delivered only to be disappointed
when the US equity market lifts itself off the mat. I’m speaking from
experience.
Perhaps this anticipated economic slowdown is so anticipated
that those of us in the doom camp are no longer the minority but now represent the
consensus view. There will be another correction, there will be another
recession and there will be another bear market at some point, but perhaps not
yet.
On Dana
Lyon’s Tumblr they point out, “So
what are these positive developments? Not the least of them is the fact that
the NYSE advance-decline line has gone to a new all-time high. As a refresher,
the advance-decline line is a running cumulative total of the daily difference
between advancing issues on the NYSE and declining issues. If this “A-D” Line
is moving upward along with the stock indexes, it represents strong
participation within the broader market. And as we have said many times, the
better the participation, the healthier the market. Since the mid-February
stock market low, the A-D Line has indeed been moving upward, hitting its first
new high in April after 355 days.”

“So what is the
significance of the new high? The NYSE A-D Line has negatively diverged at
every cyclical top in the S&P 500 in the last 50 years.”

On the daily SPX chart we can see the very sharp but
short-lived impact of “Brexit” and the miraculous “Brebound” that followed. We
were leaning short into the announcement but decided to cover our shorts around
the 2000 SPX level. Given the resiliency of the market, the psychological
importance of 2000 and the 38.2% retracement from the February lows, it seemed
appropriate to cover and wait for further action. That proved to be a
fortuitous decision.
We believe a break and close above 2120 on the SPX and
ultimately a move above the all-time high close of 2130.82 could slingshot the
market much higher. We’ll be watching the “risk-off” assets such as TLT and GLD
for further near-term confirmation that the market will head higher. My guess,
because these safe-haven assets did not sell-off as the stock market rallied
and the sudden overbought near-term condition of US equities, there could be
another opportunity to buy stocks at lower prices in the next few days or
weeks.

On the SPX weekly chart we have seemed to have broken out of
that down channel that started in the middle of last year. Even the Brexit
sell-off was unable to break this trend. RSI (14) on the weekly remains above
50 and the bullish MACD cross that occurred in March remains intact. When
comparing to the SPX equal weight index, it seems this rally goes beyond just a
few large cap leaders and appears to be a broader based move. These are all
positive events.

On a monthly basis the chart seems to be improving as well.
A few months ago I was getting prepared for a major sell-off but the technical
triggers that I was watching have changed. The negative MACD signal cross that
occurred remains intact but has leveled off as seen in the MACD histogram. It
appears a break to new highs on the SPX will provide a bullish MACD cross.
Also, the RSI (14) dipped briefly below 50 but really has been unable to break
to the downside. The market has also solidly regained its 20 month moving
average with the slope of that line improving.

From Stockcharts.com,
“Chartists will look back at the
long-term charts and try to figure out where exactly this big Brexit panic
actually occurred. Was there even such an event? There is something to be said
for monthly close-only charts because they filter a lot of noise, and June was
definitely a month with lots of noise. Despite some volatile swings, the major
indexes ended the month with little change. Outside of the Nasdaq 100, the
monthly gains and losses were between +1% and -1%.”

“The next chart shows
monthly closing prices for the S&P 500. At the risk of over simplification,
the trend and the pattern at work seem obvious to me. After falling some 17% in
2011, the index embarked on a 44 month advance that gained over 85%. $SPX was
certainly entitled to a rest after such a strong advance and the triangle
consolidation provided this rest. At 11 months, the consolidation is around a
quarter as long as the prior advance, which seems reasonable. Most importantly,
the index broke above the upper trend line with the April close and held this breakout
the next two months. This breakout means the uptrend is resuming and the index
is now less than 2% from its all time high. I would not become concerned with
the long-term uptrend unless the index closes below 2000.”

I’m certainly less bearish than I was at the start of the
year but still cautious. That said a break to new highs on the SPX will offer a
big move upward in our opinion. So how do we get to a new high and what will be
the fuel to drive the market higher.
Getting to a New High
What will propel the market to new highs in the face of
deteriorating global economics and earnings? The answer: Central banks of
course. The table below shows the market
pricing in a 0% chance of a rate hike this month and only a 2% chance in
September and November. There is an 11.8% chance of hikes in December. This is
a dramatic change from the start of the year when the Fed was telling us to
expect four rate hikes this year.

From Seeking
Alpha, Jay Unni, MD writes, “These
data stand in stark contrast to the FOMC participants' expressed views on
appropriate monetary policy. As of the last statements, FOMC participants were
still leaning towards two hikes this year:

“Obviously, rate hikes
are a negative event for liquidity. But, if you believe what the futures market
are telling you, we ought to have no negative impact on liquidity from the Fed
this year. In fact, if the Fed changes their outlook to something more dovish,
like one or zero rate hikes this year, the change in expectations might even be
a considered a positive event for liquidity.”
Lance Roberts from Real
Investment Advice summed it up best, “In
this past weekend’s commentary, I discussed the likelihood of Central Banker’s
leaping into action to stabilize the financial markets following the British
referendum to leave the E.U. To wit: “Of course, the reality is that we will
likely see a globally coordinated Central Bank response to the financial
markets over the next few days if the selling pressure picks up steam. This
will come in the form of:
Further interest rate reductions
Deeper moves into negative rate
territories
Increased/accelerate bond purchases by
the ECB
A potential short-term QE program by
the Federal Reserve
A pick up of direct equity/bond buying
by the BOJ.
Liquidity supports through FX swaps or
direct intervention
Lot’s and Lot’s of “Verbal Easing”
Not to be
disappointed, Mario Draghi sprung into action on Tuesday suggesting a greater
alignment of policies globally to mitigate the spillover risks from ultra-loose
monetary measures.
“We can benefit from
the alignment of policies. What I mean by alignment is a shared diagnosis of
the root causes of the challenges that affect us all; and a shared commitment
to found our domestic policies on that diagnosis.” – Mario Draghi at the ECB
Forum in Sintra, Portugal.
Furthermore, as noted
by John Plassard, a senior equity-sales trader in Geneva at Mirabaud Securities
via Bloomberg: “Stocks are rebounding on
the expectation that there will be a coordinated intervention by central banks.
What central banks can do is put confidence back in the market by telling
everyone that they are here and ready to act. If we don’t get that sort of
support, we’ll see further declines.”
Then on Thursday more
announcements came from both the Bank of England and ECB:
BOE: SOME MONETARY POLICY EASING LIKELY
OVER SUMMER
BOE: MPC WILL DISCUSS FURTHER POLICY
INSTRUMENTS IN AUG
ECB: TO WEIGH LOOSER QE RULES AS BREXIT
DEPLETES ASSET POOL
ECB: OPTIONS TO INCLUDE MOVING AWAY FROM QE
CAPITAL KEY
ECB: CONCERNED ABOUT SHRINKING POOL OF
ELIGIBLE DEBT”
We believe the quick rebound in equity prices in the US are
a reflection of central bank intervention expectations. It would also seem that
the Brexit issue is still largely viewed as a political risk as opposed to an
economic risk. In an article in USA
Today, “There’s more than just
cynicism, to suggest that the stock market may be overreacting to the Brexit
decision. Consider a study of 51 major geopolitical crises since the beginning
of the 20th century that was compiled by Ned Davis Research. The list includes
events that most everyone would agree are even more momentous than whether or
not the U.K. ways a member of the EU—events such as the 9/11 terrorist attacks,
Pearl Harbor, the Cuban missile crisis and the Kennedy assassination.
The firm found that,
more often than not, the stock market quickly recovers from the losses it
inevitably incurs in the immediate aftermath of such a crisis. On average
across all 51 crises, the Dow Jones industrial average within six months was
higher than where it stood prior to the market’s initial plunge. Within a year
it was 6.3% higher.”
Another article in USA
Today, Sam Stovall, chief equity strategist at S&P Capital IQ discusses the impact of political vs. economic
shocks, “In general, the stock market
tends to rebound quickly following shocks, once it is determined that the
economy won't be irreparably harmed by the event, says Stovall… In fact, on a
median basis, shocks normally cause stocks to bottom out six days after the
shock hits, with a total drop of 5.3%. And in looking at the 14 market
"shocks" since World War II, the market has taken a median of just 14
days to recover all its losses, S&P Capital data show.”
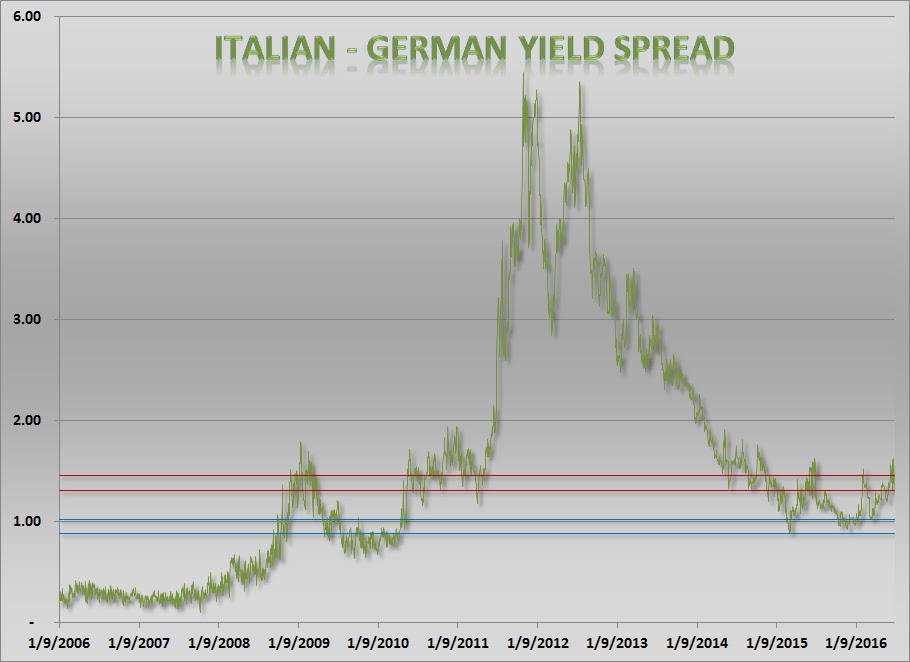
We believe that to be the case given the massive declines in
European government yields (and global sovereign yields for that matter) but
yield spreads between European nations are elevated but not running wild like
in 2011 during the Euro banking crisis.


The slingshot Effect
If we break new highs on the SPX (Nasdaq and Russell 2000
have a little further to go than the S&P 500 but I believe a rising tide
will lift all boats) then we expect the market to slingshot further from there.
As I mentioned earlier, this anticipated correction is so anticipated that many
investors will probably jump into the market looking to capitalize on gains for
the year. I certainly know I will be one of them. I say this because market
sentiment is unusually subdued given how close we are to new all-time highs in
the stock market.
AAII Investor
Sentiment
Looking at the AAII Investor Sentiment Survey, the latest
reading of those surveyed show 28.9% of those surveyed as bullish, 33.4% as
bearish and 37.7% as neutral. The 28.9% bullish read is less than the long-term
average of 38.8% and the bearish reading is slightly more than the 30.6%
long-term average. Given the contrarian nature of this index, these readings
are a bit unusual while the market is near all-time highs. The bullish/bearish
ratio that we track is clearly giving a contrarian buy signal.
In a recent poll taken, AAII
states, “Last month’s Asset Allocation
Survey special question asked AAII members what, if any, allocation changes
they expect to make during the second half of this year. One out of three
respondents (33%) intend to increase their equity exposure. Several of these
respondents said they would do so if stock prices were to drop by putting cash
to work. Conversely, 18% intend to raise cash, with several selling stocks to
do so. Approximately 10% plan on
boosting their bond exposure. More than 26% of respondents do not intend to
make any changes or to make only very modest changes.”
We believe the results of this poll provide further evidence
that there is new money on the sidelines waiting to be deployed.

What is most impactful in this reading is the amount of
people that say they are neutral towards the market. While the percent bullish
reading is very low, many participants that would normally be bearish are
neutral. We tend to think that if the market starts hitting new highs, you will
see more participants in this survey gravitate from neutral/bearish to bullish.
That change in sentiment could propel the market higher.


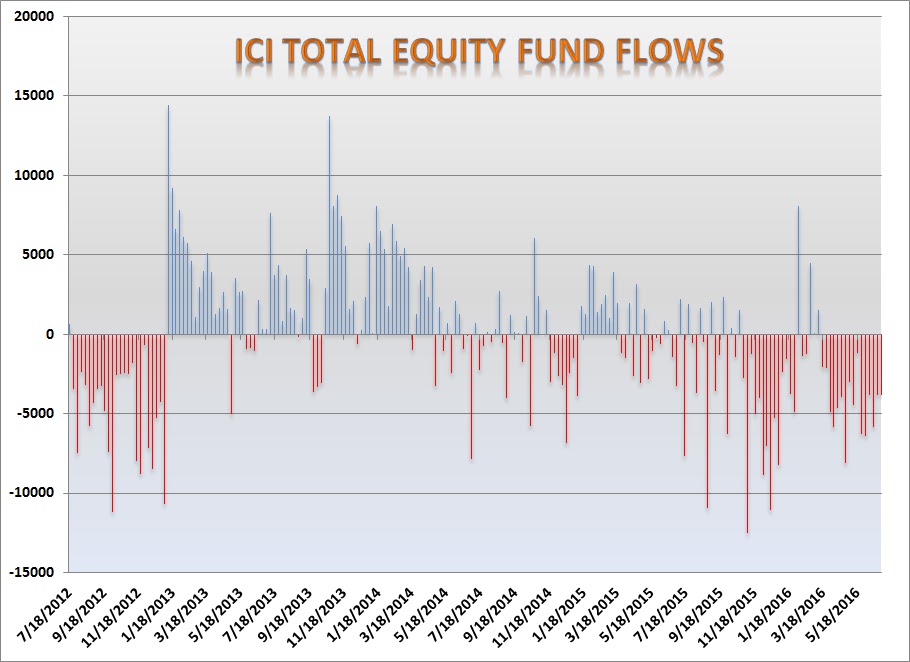
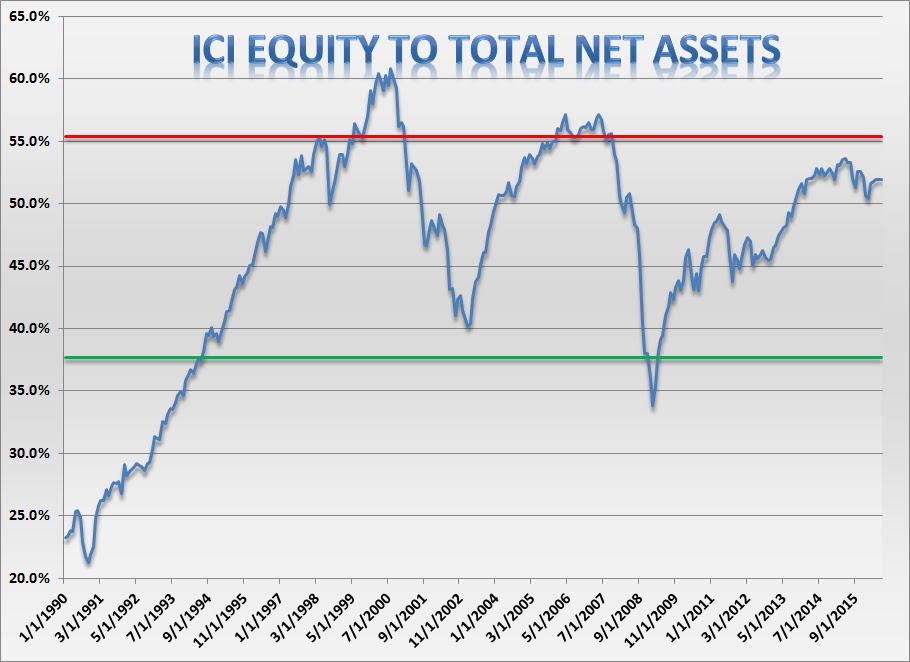
Fund Flows
Looking at total ICI fund flows, we find money flows into
pure equity funds has been on the decline for roughly a year and equity
investments as a percent of total investments is elevated but not near the
super-euphoric levels last seen before the prior two bear markets. One tends to
think with the market starting to hit new highs, and as the fear of being left
behind takes hold, money will start to gravitate back into the equity markets
providing addition buying power.
In a recent post on The
Fat Pitch, “Fund managers cash levels
at the equity low in February were 5.6%, the highest since the post-9/11 panic
in November 2001, and lower than at any time during the 2008-09 bear market.
This was an extreme that has normally been very bullish for equities.
Remarkably, with the SPX having since risen 17%, cash in June is now even
higher (5.7%) and at the highest level in 14 years (since November 2001). Even November 2001, which wasn't a bear
market low, saw equities rise nearly 10% in the following 2 months. This is
supportive of further gains in equities.”

“US exposure is still
near an 8 year low (-15% underweight; it was -19% underweight in February).
Despite low exposure, US equities have outperformed during the past year. US
equities have been under-owned and should continue to outperform other regions
on a relative basis”

Corporate Insider
Sentiment
The Sabrient Insider Sentiment Index is an equal- dollar
weighted index comprising publicly-traded companies that reflect positive
sentiment among those 'insiders' closest to a company's financials &
business prospects (top mgmt., directors, and analysts) Index base value 100 as
of 1/3/2000. This sentiment index has a fairly tight fit with the S&P 500.
As can be seen in the charts below, there has been a bit of a divergence of
late. While the market is approaching new highs, the sentiment index has been
declining. When you look at the year-over-year change in this sentiment index,
the levels currently seen are more indicative of a market bottom than a market
top. This feeds into my general thesis that a coming correction is anticipated
even by corporate insiders. Breaks to new highs should improve this reading as
well.


While insider sentiment remains quite high, should it start
to increase again it would be a bullish sign for the market as corporate
buybacks, increasing dividends and acquisitions are all considered a positive.

From Seeking
Alpha, “Note in the above figure,
that companies spent all of their accumulated cash, and are now actually
issuing debt to buy back shares and invest in acquisitions. Creating debt for
buybacks or acquisitions directly adds liquidity to markets, and I believe it
is a huge factor holding up the market. Dividends also increase liquidity in
markets because of dividend reinvestment.”
Put/Call Spread
The US equity put/call ratio briefly nudged into the panic
region but quickly can down as the dust settled. If we look at the long term
put/call z-score we’ll see the long-term average (200 day moving average) is
nearly 1 standard deviation more than the mean, which signifies a very high
level of market nervousness usually indicative of a contrarian buy signal.
Further proof in our opinion that the anticipation of a coming correction in
the near-term is not an outlier notion but more of a consensus view.


Bottom Line: Our
views on the health of the global and US economy and corporate earnings remain
pessimistic and we do believe we are near a cyclical top in the US equity
markets. That said this Rocky Balboa market seems to be trading more on central
banking monetary policy events and sentiment. The fundamentals need to be
placed on the back burner for the time being.
We think the market
breaking new highs is a likely event due to the Brexit outcome (ironically) and
central banking responses to that outcome. Once that happens there is enough
sentiment fuel to drive the market significantly higher from there, perhaps to
a blow-off top where fundamentals become more important in the investment
decision-making process. A failure to break new highs results in a continued
trading range and challenging trading environment. Breaks below February lows
in the S&P 500 and we will start trading to the short side once again.
To all of our friends
and family, have a safe and healthy July 4th. God Bless America.
Joseph S. Kalinowski, CFA
Email: joe@squaredconcept.net
Twitter: @jskalinowski
Web Site: http://www.squaredconcept.net/
Additional Reading
The Latest Margin Debt Figures Show Risk Still Outweighs
Reward In Owning Stocks – The
Felder Report
Oops! - TradeFollowers
Mooning the Elite – Acting Man
Price To Sales Ratio – Another Nail In The Coffin? – Real
Investment Advice
What the Bond Market is Telling Investors – Sober
Look
Pimco Says Market Underestimates Fed Rate Path, Recommends
TIPS - Bloomberg
No part of
this report may be reproduced in any manner without the expressed written
permission of Squared Concept Asset Management, LLC. Any information presented in this report is
for informational purposes only. All
opinions expressed in this report are subject to change without notice. Squared Concept Asset Management, LLC is a
Registered Investment Advisory and consulting company. These entities may have
had in the past or may have in the present or future long or short positions,
or own options on the companies discussed.
In some cases, these positions may have been established prior to the
writing of the particular report.
The above
information should not be construed as a solicitation to buy or sell the
securities discussed herein. The
publisher of this report cannot verify the accuracy of this information. The owners of Squared Concept Asset
Management, LLC and its affiliated companies may also be conducting trades
based on the firm’s research ideas. They
also may hold positions contrary to the ideas presented in the research as
market conditions may warrant.
This analysis
should not be considered investment advice and may not be suitable for the
readers’ portfolio. This analysis has been written without consideration to the
readers’ risk and return profile nor has the readers’ liquidity needs, time
horizon, tax circumstances or unique preferences been taken into account. Any
purchase or sale activity in any securities or other instrument should be based
upon the readers’ own analysis and conclusions. Past performance is not
indicative of future results.
No comments:
Post a Comment