We are encouraged by the recent market rally and believe we
could rally further as additional bullish sentiment creeps into the financial
picture. A strong dose of FOMO (fear of missing out) could be the catalyst to
drive the market higher. That said our radar is on high alert for a pullback in
the market in the coming weeks and months. We are laying out our strategy on
how we expect to position ourselves through the remainder of the year.
Near-term Technicals
Warrant Caution
The daily S&P 500 shows a decent consolidation trend
after digesting the gains over the past few weeks but is definitely overbought.
We believe a pullback to its previous high of 2130 (green line) isn’t the end
of the rally and could prove a healthy pullback. Other levels we’ll be watching
are 2120 (blue line) which was the old resistance and 2100 which is the 50-day
moving average (red moving average). We expect a move back to these levels over
the next several weeks, viewing how these levels hold and monitoring volume
activity.
We also note that the daily MACD is very close to a bearish
cross and that loss of momentum could be a sign of coming weakness. The percent
of companies above their 50 and 200-day moving averages have peaked and the
percent of companies in bullish P&F formations are also at extended levels.
This does not guarantee a coming correction. This could just be a period of
cooling until the next leg up occurs.

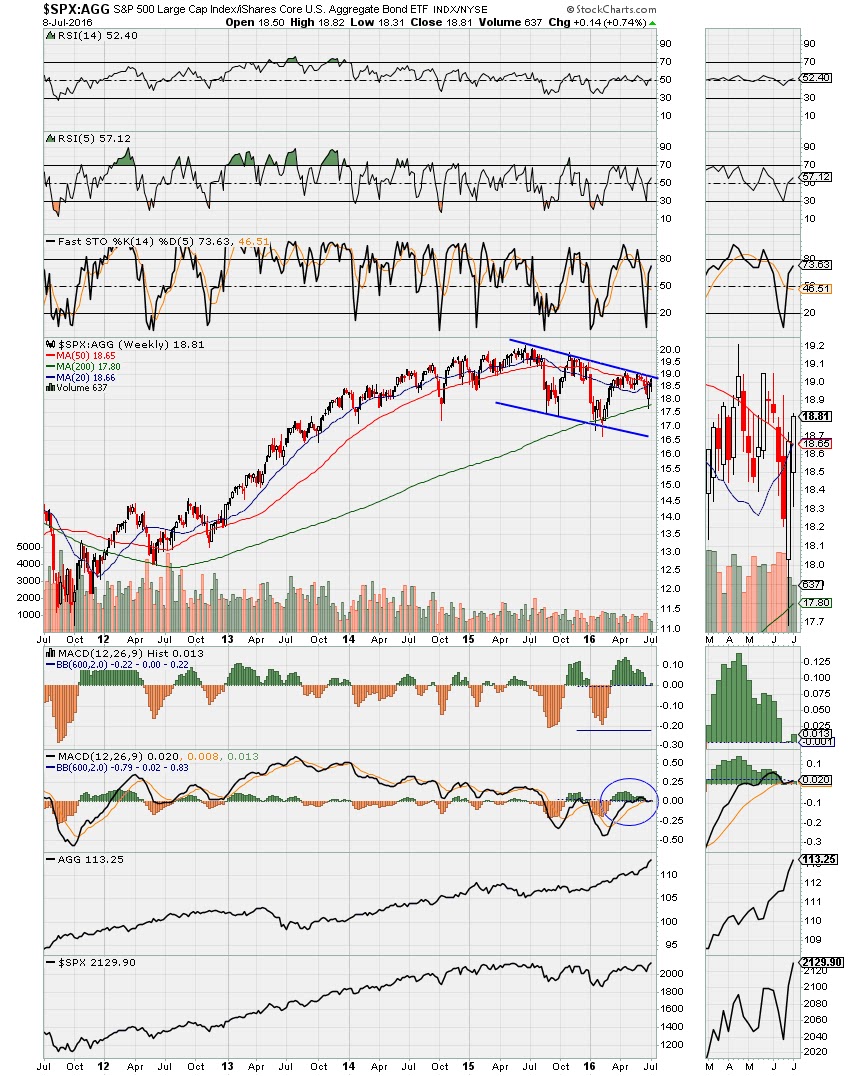
The SPX weekly chart looks good. We can see the breakout from its trading channel, RSI (14) is above 50, although the faster moving oscillators are overbought currently but again, that doesn’t predict a coming correction. The bullish MACD cross that occurred earlier this year still holds and the recent rally has been broad-based by equal weight as seen in the chart below (RSP:$SPX). We can see our levels on this chart. A break back to 2000 would be very discouraging but a significant breach of that level could spell loads of trouble and may have us thinking shorting the market again.

On the daily Nasdaq chart, we are approaching key levels
after the breakout that occurred this month. Tech and Biotech enjoyed a nice
rally recently. We are hitting some overhead resistance and overbought
conditions that could prove challenging but a tepid pullback over the next few
weeks could be exactly what we need to keep this advance going. We like the
fact that volume has been increasing as the Nasdaq went higher last month. The
MACD bullish cross remains intact but is waning somewhat but much less than the
S&P 500.

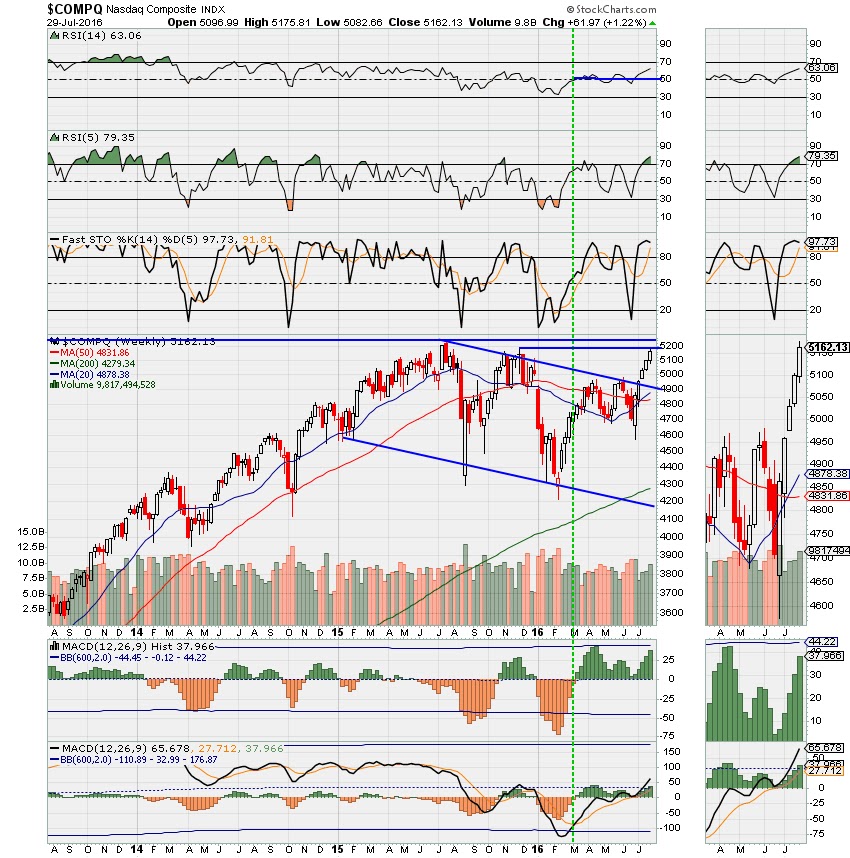
The weekly Nasdaq chart shows the breakout from its trading
channel along with the overhead resistance on the horizon. The MACD bullish
cross remains intact and the oscillators are overbought but healthy. A pullback
and support to the top of the trading channel near 4900 wouldn’t jeopardize the
current rally in our view.
Reading Lance Roberts from Real
Investment Advice sheds additional light on the near-term market prospects.
He writes, “The consolidation over the
past week DID pull the deviation back from 3-standard deviations above the
50-dma to just 2-standard deviations. This didn’t solve much of the problem as
of yet.
Importantly, there are
TWO ways to solve an overbought and overextended market advance. The first is
for the market to continue this very tight trading range long enough for the
moving average to catch up with the price.
The second is a
corrective pullback, which is notated in the chart above. However, not all
pullbacks are created equal.
1. A pullback to 2135,
the previous all-time high, that holds that level will allow for an increase in
equity allocations to the new targets.
2. A pullback that
breaks 2135 will keep equity allocation increases on “HOLD” until support has
been tested.
3. A pullback that
breaks 2080 will trigger “stop losses” in portfolios and confirm the recent
breakout was a short-term “head fake.””

He goes on to state, “The
next chart shows the 9.3% advance from the “Brexit” low. The momentum “buy”
signal was triggered fairly early in the advance along with an upturn in
volume. However, both of those
indicators are now beginning to turn lower which would also suggest that a
corrective action is likely in store in the days or weeks ahead.”

He also points out a recent study by BAML writing, “Then there is this tidbit:
We’re about to step
into seasonality ditch: lowest 3-month returns Aug-Oct for S&P going back
to 1928
Source: BoA ML
pic.twitter.com/Q5S5JSQdvr
— Babak (@TN) July 29,
2016”

We found more statistics on the potentially soft market
action in the coming weeks and months from The
Fat Pitch. He writes, “An third
reason to expect a reaction in August is that the month is seasonally weak and
often volatile. Recall that July is typically the strongest month of the
summer. In comparison, August is one of the weakest months, especially over the
past 10 and 20 years (data from Ryan Detrick and Bloomberg).”


“But what sets August
(and September) apart is not that the month ends badly but that the interim
drawdown within the month can be severe. A 5% decline in August (or September)
is nearly twice as likely as during any other month (data from Sam Stovall).”

Political Unrest
We are in the throes of election season and one can surely
anticipate the mudslinging to kick into high gear. The race is tight as seen by
the latest polling from Real
Clear Politics. Head-to-head nationally Clinton leads
Trump by 1.1%, but adding in Johnson, Trump leads Clinton by a fraction. Add
Stein to make it a four-way race and both are tied. A close race thus far so
expect the rhetoric to really pick up from here.


According to Almanac
Trader, “July’s big rally has pushed
the DJIA well into incumbent winning territory. As you can see below this has
not been typical July market action. The usual second half of July weakness
never materialized. Once the market realized that Brexit was no imminent threat
or a clear and present danger, stocks quickly erased the two-day post-Brexit
selloff and rallied to new all-time highs on the DJIA and S&P 500 in
relatively short order.
Since economic data
has not impressed the Fed enough and continues to ebb and flow every month,
it’s unlikely we’ll see another rate increase until after the election. Earning
season went off without a hitch as companies overall did not disappoint Wall Street
much, though we were not overly impressed.
Buoyed also by
earnings numbers that mostly beat lowered forecasts and the promise of
continued accommodative monetary policy for the foreseeable future, this rally
has pushed the DJIA well above any of the rosiest scenarios for an election,
which has historically, been a vote of confidence for the incumbent
presidential party.”


The chart below shows that this market has been performing
quite well when compared to other election years. The green line represents
election years when there is no sitting President running and the red line
represents the market performance this year thus far. What’s interesting on
this chart is the orange line that shows how the stock market had traded in the
years when the incumbent party won the election. If the market continues
this pace it appears Clinton will hold the edge going into November.

As far as future market performance Jeff Hirsch writes, “If anything we should all find at least
some solace in the continued civilized, yet enthusiastic and sometimes heated
debates of the open political process that this great nation continues to be
built on. However, as two of the most unfavorable candidates head into the home
stretch of a virtual dead heat presidential election campaign, things are bound
to get uglier and spook the market.”
This election year sell-off will most likely happen in
August through September. According to Almanac
Trader, since 1952 (when agriculture started to play less of a role in our
economy) the third quarter of an election year is historically the weakest
quarter on the year. The fourth quarter of an election year is the strongest.
This holds with our notion that a pullback over the next weeks and months
should be followed by an additional thrust upward.

David Kotok, the chief investment officer of Cumberland
Advisors points out (via Business
Insider), “After the Brexit vote took
the wheel of the economy for a while, Japan's recent elections have also influenced
global assets. On the horizon, the US presidential election should have a
pretty firm grip on the market until voting finally happens in November.
"The race between
Trump and Clinton is creating a whole lot of uncertainty," said Kotok.
"People really aren't sure what to make of either candidate or the race,
and it's going to make the market unstable until the election happens."
Add in Spanish and
Italian elections in September and October, respectively, and there's almost no
period for the rest of the year without some sort of political event.”

“Political events are
harder to predict than some business events. Thus, markets are more likely to
be caught flat-footed like they were after the Brexit vote, leading to wild
swings in prices. Dealing with such swings is what will separate the good
investors from the bad, according to Kotok.”
Long-Term Prospects
Are Solid
The monthly chart of the S&P 500 shows a potential
upward bias to the market longer-term. The market has recently broke out of its
trading range and the monthly MACD has been improving and is on the verge of a
long-term bullish cross. Both RSI (14) and stochastics have held up well during
the recent sell-off and momentum seems to be improving. The same can be said for
the Nasdaq on the monthly chart.


A recent post in See
It Market states, “While some
near-term trends have cooled, the longer-term industry group trends remain
firm. Some 80% of the industry groups in the S&P 1500 are now in up-trends.
The behavior of this indicator in 2016 is in sharp contrast to the
deterioration that was seen over the course of not only 2015 but 2014 as well
(when the pattern of lower highs and lower lows started to emerge). Without a
significant change in character, this indicator suggests any pullbacks seen
over the near term could limited in degree and duration.”

We recently commented about a potential “melt-up” in the
market as earnings data improves and bullish sentiment takes hold. It has been
stated by many that this coming melt-up will represent the fifth wave of the
bull market according to Elliot Wave Theory. From The
Fat Pitch, “Our best guess is that US
equities are in the final "wave 5" of the 7 year bull market. In
Elliot Wave terminology, bull markets advance in 5 waves: waves 1, 3 and 5 move
higher while waves 2 and 4 are interim corrections. The basic structure is
shown below.”

“One of the main
defining characteristics of this pattern is that "wave 3" is normally
the longest. In the current bull market, that would correspond to the long
2011-15 advance. "Wave 2" was the steep 20% correction in 2011 that
some consider a bear market. In
comparison, "wave 4" is often a "flat" correction: this
corresponds to the flat trading range that persisted through much of 2015 and
the first half of 2016. The new highs for both SPX and NDX indicate that
"wave 5" is now underway.”

“A literal
interpretation of this pattern would imply that SPX is headed above 2500, about
20% higher. Instead of a price or calendar target, we think it makes much more
sense to monitor the data. "Wave 5" will likely top when sentiment
becomes excessively bullish. If waves 1 and 3 are characterized by
"skepticism" and "acceptance", respectively, then the final
push in a bull market is typically "euphoric". At the 2007 market
top, fund managers' equity allocation was nearly 60% overweight and cash was
under 3.5%. At the end of "wave 5", we will also start to see
employment, housing and various measures of consumption start to flatten and
weaken.”
The Return of
Fundamentals
It’s no secret that corporate fundamentals have been weak.
Earnings and revenue growth have been nonexistent through this latest rally.
Some believe the latest rally stems more from a willingness from investors to
move to risky assets as yields on fixed income plummeted. According to the
folks at Deutsche Bank (via Business
Insider), “According to Dominic
Konstam and team, writing in a note Friday, the rally is about the declining
equity risk premium, which is simply the excess return the stock market
provides over a risk-free rate like bond returns.
The premium jumped
after stocks plunged in the financial crisis, with investors demanding as much
as 7% more from choosing stocks over bonds. It has now fallen closer to its
historical norm of 2% as bond yields also fell, implying that the return
investors require to be compensated for their risky investments in stocks has
fallen.
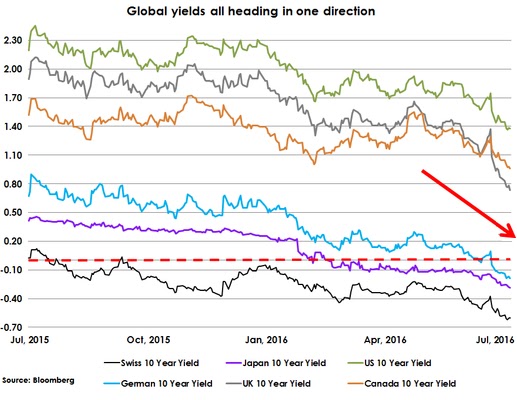
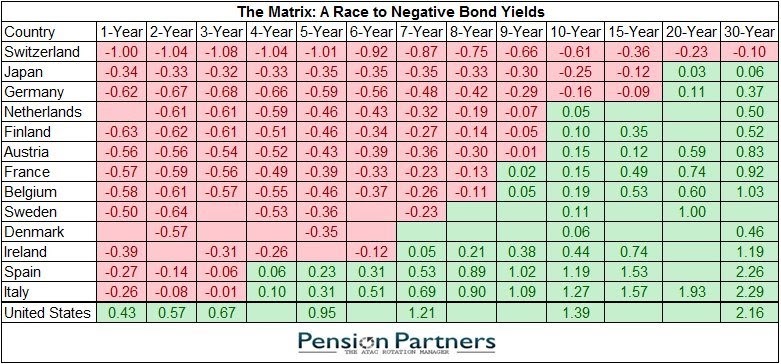
The sovereign bond
yields in many developed countries are at or near record lows. Yields on
benchmark bonds in Germany and Japan plunged deeper into negative territory
after the rush to government-debt markets sparked by the UK's decision to leave
the European Union.
As nominal yields have
fallen, investors have rotated into higher-yielding assets, Konstam said.
From the note:
"The current
cycle stands out in that earnings have played almost no role in the SPX rally.
In fact, earnings were a slight drag on equities and were only offset by an
aggressive multiple expansion. More than 90 percent of the rally was attributed
to a collapse in equity risk premium ... In sharp contrast, the equity gains in
the 1980s and 2000s were all about earnings growth, and in 1990s earnings still
accounted for more than half of the rally."”

Our view is that an improvement in the revenue and earnings
outlook could be a net positive in a market that has already priced in a mild
earnings recession. It still appears the US economy, albeit quite weak will
avoid a recession and that may be enough to drive equities.
Indeed we seem to have gotten good news on the earnings
front this week from FactSet.
They write, “During the month of July,
analysts lowered earnings estimates for companies in the S&P 500 for the
quarter. The Q3 bottom-up EPS estimate (which is an aggregation of the EPS
estimates for all the companies in the index) dropped by 0.7% (to $30.44 from
$30.66) during this period…During the past year (4 quarters), the average
decline in the bottom-up EPS estimate during the first month of a quarter has
been 2.7%. During the past five years (20 quarters), the average decline in the
bottom-up EPS estimate during the first month of a quarter has been 2.3%.
During the past ten years, (40 quarters), the average decline in the bottom-up
EPS estimate during the first month of a quarter has also been 2.3%. Thus, the
decline in the bottom-up EPS estimate recorded during the first month of the
third quarter was smaller than the 1-year, 5-year, and 10-year averages.”
It is understood that analysts will reduce their quarterly
and annual estimates as the year progresses, but a significant decline in the
rate of change in those downward revisions are a positive event. That appears
to be what we are seeing.
They also note, “The
blended (combines actual results for companies that have reported and estimated
results for companies yet to report) revenue growth rate for the S&P 500
increased to 0.1% this past week, which is above the year-over-year decline of
-0.3% at the end of last week and the year-over-year decline of -0.8% at the
end of the second quarter (June 30). If the index reports growth in revenues
for the quarter, it will mark the first time the index has seen year-over-year
growth in sales Q4 2014 (2.0%).”
The revenue figures that have been reported thus far for
2Q16 have pushed the expected revenue growth figure into positive territory for
2Q16. Earnings growth expectations are still negative for 2Q16 but have also
improved. Given the slowdown in the rate of deterioration of financial
projections along with the magnitude of positive surprises (both revenue and
earnings beats are above historical norms according to FactSet) means we could
see corporate fundamentals improve beyond expectations. Should the global
economic picture worsen then all bets are off. We need to keep a close watch on
this.
One professional that isn’t convinced of the rebound in
corporate fundamentals is Byron Wien, vice chairman at Blackstone Group. In a
recent article by Business
Insider they go on to state, “The
main problem is wage growth, according to Wien. Modest revenue growth, coupled
with a lack of pricing power among companies, means that margins have to be
squeezed as wages climb.
"Profit margins are coming down and labor
share of corporate GDP is going up," he said. "So my view is that
there's a margins squeeze going on. You saw it in the first-quarter earnings,
and I think you'll see it manifested throughout the year."
He also thinks that a
correction is likely because of high stock market valuations and investor
euphoria, although a bear market and recession are unlikely to happen.”
Indeed we have written in the past that margins have begun
to deteriorate and significant margin contraction can lead to bad things in the
US equity markets as seen in the chart below.

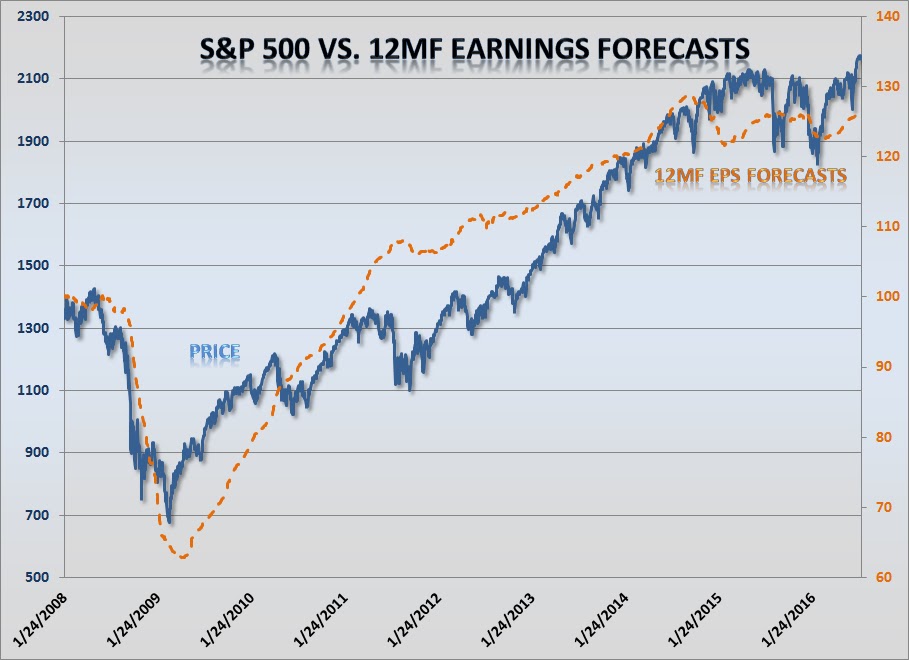
We could also make the argument that the market is 10% to
15% overvalued at current levels but the one bright spot is that the
fundamental picture has started to improve. The chart below shows the
trajectory of analysts twelve month forward bottom up EPS forecasts relative to
the market. We can see that the downward trend in forward earnings forecasts
have turned higher with the market. The chart below that confirms the trend
showing an uptick in the slope of forecasted earnings. A pick-up in the rate of
EPS acceleration would surely benefit stock prices.

Even the point of valuation is defended by some of the
greatest minds on Wall Street. Richard Bernstein of Richard Bernstein Advisors in his latest
commentary states, “Many income-centric
investors believe that the equity market is significantly overvalued simply
because the market PE seems high relative to history. However, PE ratios in
isolation have not historically been good forecasters of future returns because
PEs must be related to interest rates and inflation.
There is an old
investment rule-of-thumb called the Rule of 20 that uses combinations of
headline inflation and the S&P 500® PE to determine fair value. Our
valuation models are, of course, more elaborate than the simple Rule of 20, but
based on a more rigorous analysis of inflation and PE ratios, the current
equity market appears, at worse, to be fairly valued. Investors forget that
inflation was increasing leading up to the 2008 bear market. In fact, the CPI,
which is a lagging indicator, peaked at 5.6% in July 2008. Today’s headline
inflation is 1.0%.
The chart below shows
combinations of inflation and valuations over the past 50 years or so. The
current observation does not suggest investors need to be as defensive and
income-centric as they are currently.”

Bottom Line: We have
changed our thinking from the beginning of the year. We initially thought the
market top was in but as the technical, behavioral and fundamental picture
changed, so have our investment thesis.
We are preparing for
a market melt-up as sentiment catches up with the easy monetary policy driven
rally and improving corporate fundamentals. That said we believe the months of
August and/or September will offer a pull-back in the market as an opportunity
to increase long exposure.
We are nearly fully
invested towards the long side currently but will start to raise cash (not go
short) after one or two distribution days. Once the sell-off completes its
course and as long as the new technical levels hold, we will use the opportunity
of a pullback to rebalance our positions.
Joseph S. Kalinowski, CFA
Email: joe@squaredconcept.net
Twitter: @jskalinowski
Facebook: https://www.facebook.com/JoeKalinowskiCFA/
Blog: http://squaredconcept.blogspot.com/
Web Site: http://www.squaredconcept.net/
Additional Reading
No part of this report may be reproduced in any manner
without the expressed written permission of Squared Concept Asset Management,
LLC. Any information presented in this
report is for informational purposes only.
All opinions expressed in this report are subject to change without
notice. Squared Concept Asset
Management, LLC is a Registered Investment Advisory and consulting company.
These entities may have had in the past or may have in the present or future
long or short positions, or own options on the companies discussed. In some cases, these positions may have been
established prior to the writing of the particular report.
The above information should not be construed as a
solicitation to buy or sell the securities discussed herein. The publisher of this report cannot verify
the accuracy of this information. The
owners of Squared Concept Asset Management, LLC and its affiliated companies
may also be conducting trades based on the firm’s research ideas. They also may hold positions contrary to the
ideas presented in the research as market conditions may warrant.
This analysis should not be considered investment advice and
may not be suitable for the readers’ portfolio. This analysis has been written
without consideration to the readers’ risk and return profile nor has the
readers’ liquidity needs, time horizon, tax circumstances or unique preferences
been taken into account. Any purchase or sale activity in any securities or
other instrument should be based upon the readers’ own analysis and
conclusions. Past performance is not indicative of future results.