Monday, May 29, 2017

Alpha Prime Trading Journal for the Week Ended 5/26/17


Joseph S. Kalinowski, CFA

Email: joe@squaredconcept.net
Twitter: @jskalinowski
Facebook: https://www.facebook.com/JoeKalinowskiCFA/
Blog: http://squaredconcept.blogspot.com/
Tumblr: trader-rants


No part of this report may be reproduced in any manner without the expressed written permission of Squared Concept Asset Management, LLC.  Any information presented in this report is for informational purposes only.  All opinions expressed in this report are subject to change without notice.  Squared Concept Asset Management, LLC is a Registered Investment Advisory and consulting company. These entities may have had in the past or may have in the present or future long or short positions, or own options on the companies discussed.  In some cases, these positions may have been established prior to the writing of the report. 

The above information should not be construed as a solicitation to buy or sell the securities discussed herein.  The publisher of this report cannot verify the accuracy of this information.  The owners of Squared Concept Asset Management, LLC and its affiliated companies may also be conducting trades based on the firm’s research ideas.  They also may hold positions contrary to the ideas presented in the research as market conditions may warrant.
This analysis should not be considered investment advice and may not be suitable for the readers’ portfolio. This analysis has been written without consideration to the readers’ risk and return profile nor has the readers’ liquidity needs, time horizon, tax circumstances or unique preferences been considered. Any purchase or sale activity in any securities or other instrument should be based upon the readers’ own analysis and conclusions. Past performance is not indicative of future results.


Sunday, May 21, 2017

SKEW Index Hints Towards Strong Market Performance in the Months Ahead


“The CBOE SKEW Index ("SKEW") is an index derived from the price of S&P 500 tail risk. Similar to VIX®, the price of S&P 500 tail risk is calculated from the prices of S&P 500 out-of-the-money options. SKEW typically ranges from 100 to 150. A SKEW value of 100 means that the perceived distribution of S&P 500 log-returns is normal, and the probability of outlier returns is therefore negligible. As SKEW rises above 100, the left tail of the S&P 500 distribution acquires more weight, and the probabilities of outlier returns become more significant. One can estimate these probabilities from the value of SKEW. Since an increase in perceived tail risk increases the relative demand for low strike puts, increases in SKEW also correspond to an overall steepening of the curve of implied volatilities, familiar to option traders as the "skew".” https://www.cboe.com/products/vix-index-volatility/volatility-indicators/skew

The CBOE SKEW Index has been rising over the past several months and closed Friday at 131.39. This increase in perceived tail risk has fallen very dramatically from the peaks of several weeks/months ago. We track the MACD (20,50,10) on the SKEW and overlay the Bollinger Band with a (200,1) setting. What we find is that the market (S&P 500) outperforms significantly in the several weeks and months following a drop below one and two standard deviations from the mean.


We examined the SKEW Index back to 1990 and found that when the SKEW MACD (20,50,10) drops below one standard deviation from the mean (as it is today) the S&P 500 has shown better than average performance.

Let’s start with the expected one-month SPX performance when the model sits below one standard deviation. Out of 6619 observations this event has occurred 1197 times or only 18% of the time since 1990. When the model has dropped below one standard deviation the average one-month return for the S&P 500 has been 1.9% compared to only 0.5% in the occurrences when the model was above one standard deviation. In the occurrences when the model was below one standard deviation the market went on to be higher 70.5% of the time compared to just 61.0% of the time when the model was above one standard deviation.

If we come across the very rare occurrence when the model drops below two standard deviation (this only happened 175 times out of 6619 observations or 2.6% of the time) the forward one-month returns were even more pronounced. At minus two standard deviations, the S&P 500 was up on average 2.4% in the next month and was up 76.0% of the time.

Compare this to when the model is over one standard deviation. The average one-month return is just 0.4% on average and up only 61.4% of the time. When the model is above two standard deviations (this only happened 4% of the time since 1990) the average one-month return is 0.0% and is up 58.8% of the time.

The chart below shows the average one-month return of the SPX at different model intervals.


The two month return for the SPX are equally impactful when the model reaches its outlier levels.

At minus one standard deviation the average two-month return is 2.5% and up 70.8% of the time as opposed to just 1.2% and 64.3%, respectively when the model is above minus one standard deviation.

At minus two standard deviations the SPX averages 3.3% over two months and is up 77.7% of the time.


We have conducted this study using three and six months returns as well and the results are still impressive, although it seems the greatest returns come in within the first two months. We have attached the following charts to show the three and six months returns as well as a graphic for review.


Bottom Line: Using the SKEW Index is one of many tools used to determine our tactical strategy and portfolio hedging decisions. Based on the historical data used here, it would indicate that the market will continue its upward trend as it strives for ever new highs.

Joseph S. Kalinowski, CFA

Email: joe@squaredconcept.net
Twitter: @jskalinowski
Facebook: https://www.facebook.com/JoeKalinowskiCFA/
Blog: http://squaredconcept.blogspot.com/
Tumblr: trader-rants


No part of this report may be reproduced in any manner without the expressed written permission of Squared Concept Asset Management, LLC.  Any information presented in this report is for informational purposes only.  All opinions expressed in this report are subject to change without notice.  Squared Concept Asset Management, LLC is a Registered Investment Advisory and consulting company. These entities may have had in the past or may have in the present or future long or short positions, or own options on the companies discussed.  In some cases, these positions may have been established prior to the writing of the report. 

The above information should not be construed as a solicitation to buy or sell the securities discussed herein.  The publisher of this report cannot verify the accuracy of this information.  The owners of Squared Concept Asset Management, LLC and its affiliated companies may also be conducting trades based on the firm’s research ideas.  They also may hold positions contrary to the ideas presented in the research as market conditions may warrant.
This analysis should not be considered investment advice and may not be suitable for the readers’ portfolio. This analysis has been written without consideration to the readers’ risk and return profile nor has the readers’ liquidity needs, time horizon, tax circumstances or unique preferences been considered. Any purchase or sale activity in any securities or other instrument should be based upon the readers’ own analysis and conclusions. Past performance is not indicative of future results.


Alpha Prime Trade Journal - Week Ended 5/19/17


This week was an excellent test of the beta-neutral hedging strategy. The market sold off aggressively on Wednesday and we sustained minimal damage to our returns for the week. In fact, given the softness we saw mid-week, we had a very profitable week despite being stopped out of so many long positions.

The portfolio had an increase of 0.6% this week while the S&P 500 was down almost -0.4%. Since we started trading the portfolio five weeks ago we have a cumulative gain in the portfolio of 2.2% (unlevered) while the S&P 500 is down -0.3%.

Portfolio Metrics


Portfolio Stats & Performance


Long Portfolio

Short Portfolio


Closed Long Positions


Closed Short Positions


Joseph S. Kalinowski, CFA

Email: joe@squaredconcept.net
Twitter: @jskalinowski
Facebook: https://www.facebook.com/JoeKalinowskiCFA/
Blog: http://squaredconcept.blogspot.com/
Tumblr: trader-rants


No part of this report may be reproduced in any manner without the expressed written permission of Squared Concept Asset Management, LLC.  Any information presented in this report is for informational purposes only.  All opinions expressed in this report are subject to change without notice.  Squared Concept Asset Management, LLC is a Registered Investment Advisory and consulting company. These entities may have had in the past or may have in the present or future long or short positions, or own options on the companies discussed.  In some cases, these positions may have been established prior to the writing of the report. 

The above information should not be construed as a solicitation to buy or sell the securities discussed herein.  The publisher of this report cannot verify the accuracy of this information.  The owners of Squared Concept Asset Management, LLC and its affiliated companies may also be conducting trades based on the firm’s research ideas.  They also may hold positions contrary to the ideas presented in the research as market conditions may warrant.
This analysis should not be considered investment advice and may not be suitable for the readers’ portfolio. This analysis has been written without consideration to the readers’ risk and return profile nor has the readers’ liquidity needs, time horizon, tax circumstances or unique preferences been considered. Any purchase or sale activity in any securities or other instrument should be based upon the readers’ own analysis and conclusions. Past performance is not indicative of future results.


Monday, May 15, 2017

Fishbone Trade Journal


Any further deterioration in the stock price for BX and we’re going to get out for a small gain. We wanted to see if that support level near $30 held. We broke through to the downside on Friday.


This was a successful trade and we’ll be taking profits on Monday. We made almost 6% for the month with this trade. We don’t like that it couldn’t hold the previous high as support. We’re also seeing a bearish MACD cross. May look to re-enter the trade if it fills the gap and holds that support level.


We had a tremendous amount of upside momentum on this stock right out of the gate. It has since softened a bit. Any breach of the 50-day EMA will at the close and we will sell this position for a small gain.


This was a very successful trade and we’re up about 28% in a months’ time. We are moving our stop loss up to the mid-$63 range to attempt to lock in at least a 25% return.


ATHM is another good trade for us. We’re up approximately 18% in about one months’ time. The MACD has risen above one standard from the long-term mean. We will most likely be taking profits when a bearish MACD cross occurs.

This stock has not been good for us. They missed the mark on earnings and the stock has fallen about 11% from where we purchased it. With this one, the circumstances surrounding the earnings miss wasn’t all that impactful (revenue timing issue). We’ll most likely increase our position in this one once the stock regains its footing.


We’re up about 5% in a few weeks with LITE. On a bearish MACD cross we’ll start scaling out.


PKG is a solid performer for us. We will start to take profits on a bearish MACD cross. We’re up roughly 10% over the last few weeks.


SYF has been a complete disaster for us. We are down roughly 20% in the name after a miserable earnings report. Given the stock has fallen to severely distressed levels since being spun off from GE, it is trading like it is a company that is in major decline. Expecting 10% earnings growth in the coming twelve months and trading only 9x forward earnings, this has turned out to be a value play. Waiting to see what transpires over the coming weeks as this sell-off was way overdone.


We’re up 12% in TSEM this month. We’ll wait for a MACD bearish cross to start exiting the trade.

We’re up 6.5% this month in VMC. The MACD has just breached the upper one standard deviation level and that usually puts it on the watch list to take profits. We’ll be watching it trade for a few days/weeks before deciding.


Stock Watchlist


Joseph S. Kalinowski, CFA


Email: joe@squaredconcept.net
Twitter: @jskalinowski
Facebook: https://www.facebook.com/JoeKalinowskiCFA/
Blog: http://squaredconcept.blogspot.com/
Tumblr: trader-rants


No part of this report may be reproduced in any manner without the expressed written permission of Squared Concept Asset Management, LLC.  Any information presented in this report is for informational purposes only.  All opinions expressed in this report are subject to change without notice.  Squared Concept Asset Management, LLC is a Registered Investment Advisory and consulting company. These entities may have had in the past or may have in the present or future long or short positions, or own options on the companies discussed.  In some cases, these positions may have been established prior to the writing of the report. 

The above information should not be construed as a solicitation to buy or sell the securities discussed herein.  The publisher of this report cannot verify the accuracy of this information.  The owners of Squared Concept Asset Management, LLC and its affiliated companies may also be conducting trades based on the firm’s research ideas.  They also may hold positions contrary to the ideas presented in the research as market conditions may warrant.
This analysis should not be considered investment advice and may not be suitable for the readers’ portfolio. This analysis has been written without consideration to the readers’ risk and return profile nor has the readers’ liquidity needs, time horizon, tax circumstances or unique preferences been considered. Any purchase or sale activity in any securities or other instrument should be based upon the readers’ own analysis and conclusions. Past performance is not indicative of future results.


Sunday, May 14, 2017

Biotech's Getting Ready to Break-Out


Last summer we traded the biotech space successfully. We bought IBB between $259 - $261 and scaled out for a profit between $285 to $297 between July 1, 2016 and August 24, 2016. We accomplished the same trading LABU buying in the mid-$20’s and selling in the upper $30’s.

There are a few reasons why I anticipate getting back involved with the biotech space soon.

Seasonality

The first point I should make is the seasonality of the biotech sector. According to research done by Tom Bowley from Stockcharts.com, “During MarketWatchers LIVE on Wednesday, I discussed seasonality and mentioned that for the months May through July, the Dow Jones U.S. Biotechnology Index is the best performing industry group over these three months.  Below is the history by calendar month for the group:”

“July averages gaining 4.3% over the past two decades.  May (+1.4%) and June (+0.6%) are also historically strong months.  So while the DJUSBT faces technical challenges (primarily major price resistance near 1800), it will not hurt to have historical tailwinds as we approach and enter the summer months.”

Technical Analysis

On the daily chart for IBB biotech ETF, we see an ascending triangle pattern that has developed and this is usually a bullish pattern. A break-out above $300 is an entry point for us. We’ll buy some IBB and perhaps the 3x levered (very volatile) LABU.


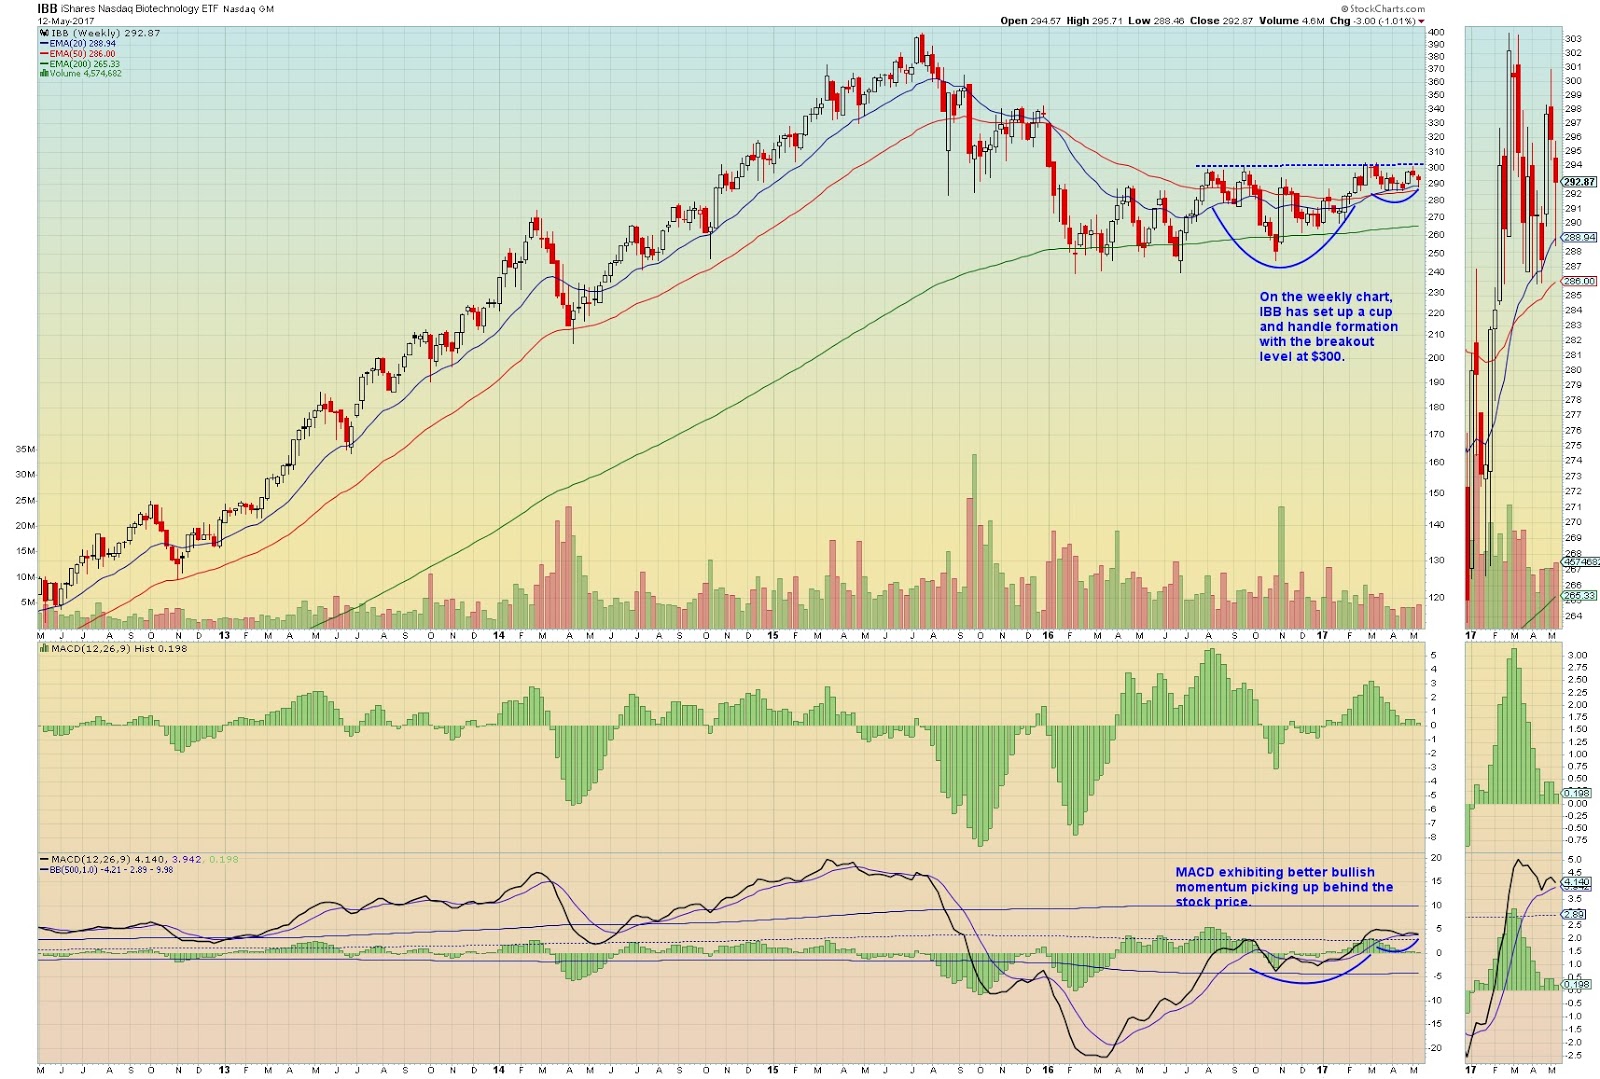
On the weekly chart, we are also seeing bullish developments. We see a bullish cup and handle formation with the break-out level above $300. This provides us further confidence of a potential trade in the works.


The point and figure graph is also exhibiting a spread triple top formation within a bullish P&F pattern. Most times this will represent consolidation and then continuation of the previous trend. It’s in a bullish pattern now so a break-out to the $304 level may see the continuation of the bullishness we’ve seen thus far.


Fundamental Analysis

Looking at both price to sales ratio and price to earnings ratio, the quant team at BAML has pointed out that the biotech sector is trading at multi-year lows relative to average valuations. A large part of this is due in part to the political environment that has placed the drug sector in a negative light. We agree with the analysis by BAML that most of this negative news is already reflected in asset prices and we believe any bit of good news on the political front, i.e. tax reform, repatriation or reduced regulatory burdens could be the fuel to drive this sector much higher.


Relative to the expected earnings growth in the coming year, GARP investors are probably watching this sector very closely. In this environment, it is difficult to find a sector offering potentially 15% forward earnings growth trading only 13x forward earnings.


They also make a point to show how underrepresented this sector is with large institutional investors. Once the political backdrop clears, we would expect rather large fund flows to find its way into the biotech space.


Political Update

According to a recent article in SeekingAlpha, “Investor sentiment has been poor for several years, and it seems that with Trump policies there could still turn out to be some pretty scary headlines ahead.

An examination of the charts for the biotech indices and immunotherapy ETF CNCR, however, provide some insight into current sentiment. Two years of index corrections should have already compensated for a reduction in corporate profit.

As reported by Fierce Biotech in March, President Trump reiterated the need to repeal Obamacare, but emphasized that the FDA process is too slow:

“But some of his toughest words were reserved for the FDA and the drug approval system, which for months now he has signaled is too slow, and could very soon be about to get a new, and possibly radical, commissioner.”

Meanwhile NPR reported on the options that the Trump administration has to tweak Obamacare, without requiring the help of Congress.

Analyst Michael Yee reported that cutting approval time could itself reduce industry costs, as well as increasing competition by moving Medicare from Part B to Part D, he also made the valid point that potential Biotech company profit reductions have already been priced in:

The "bottom line" is that biotech investors are looking at how bad it's been over the past year, but a lot of that movement has already been priced in, Yee said. Trump's policies won't result in a "worst case scenario" for the sector, he reiterated.

For example, Republicans could choose to go a number of routes to slash drug prices, including: cutting the patent life of drugs shorter to increase the pathway to generics, moving Medicare from Part B to Part D or accelerating more drugs to be approved faster, Yee said. All three would increase competition in the market.”


Joseph S. Kalinowski, CFA


Email: joe@squaredconcept.net

Twitter: @jskalinowski

Facebook: https://www.facebook.com/JoeKalinowskiCFA/

Blog: http://squaredconcept.blogspot.com/

Tumblr: trader-rants


 No part of this report may be reproduced in any manner without the expressed written permission of Squared Concept Asset Management, LLC.  Any information presented in this report is for informational purposes only.  All opinions expressed in this report are subject to change without notice.  Squared Concept Asset Management, LLC is a Registered Investment Advisory and consulting company. These entities may have had in the past or may have in the present or future long or short positions, or own options on the companies discussed.  In some cases, these positions may have been established prior to the writing of the report. 

The above information should not be construed as a solicitation to buy or sell the securities discussed herein.  The publisher of this report cannot verify the accuracy of this information.  The owners of Squared Concept Asset Management, LLC and its affiliated companies may also be conducting trades based on the firm’s research ideas.  They also may hold positions contrary to the ideas presented in the research as market conditions may warrant.

This analysis should not be considered investment advice and may not be suitable for the readers’ portfolio. This analysis has been written without consideration to the readers’ risk and return profile nor has the readers’ liquidity needs, time horizon, tax circumstances or unique preferences been considered. Any purchase or sale activity in any securities or other instrument should be based upon the readers’ own analysis and conclusions. Past performance is not indicative of future results.


Alpha Prime Trade Journal for the Week Ended 5/12/17


Portfolio Metrics


Portfolio Analysis


Closed Long Positions


Closed Short Positions


Joseph S. Kalinowski, CFA
Email: joe@squaredconcept.net
Twitter: @jskalinowski
Facebook: https://www.facebook.com/JoeKalinowskiCFA/
Blog: http://squaredconcept.blogspot.com/
Tumblr: trader-rants
 No part of this report may be reproduced in any manner without the expressed written permission of Squared Concept Asset Management, LLC.  Any information presented in this report is for informational purposes only.  All opinions expressed in this report are subject to change without notice.  Squared Concept Asset Management, LLC is a Registered Investment Advisory and consulting company. These entities may have had in the past or may have in the present or future long or short positions, or own options on the companies discussed.  In some cases, these positions may have been established prior to the writing of the report. 
The above information should not be construed as a solicitation to buy or sell the securities discussed herein.  The publisher of this report cannot verify the accuracy of this information.  The owners of Squared Concept Asset Management, LLC and its affiliated companies may also be conducting trades based on the firm’s research ideas.  They also may hold positions contrary to the ideas presented in the research as market conditions may warrant.
This analysis should not be considered investment advice and may not be suitable for the readers’ portfolio. This analysis has been written without consideration to the readers’ risk and return profile nor has the readers’ liquidity needs, time horizon, tax circumstances or unique preferences been considered. Any purchase or sale activity in any securities or other instrument should be based upon the readers’ own analysis and conclusions. Past performance is not indicative of future results.