
At the start of last year, we released our outlook for 2016
and the picture was a bit pallid. In our blog post Four Red Flags to Watch for in 2016 we
wrote, “We believe there are several
indicators that are pointing to a tough and volatile year in 2016. High Yield
spreads, interest rates, corporate earnings trends and technical deterioration
are on our radar as hints that the market could be heading lower. Will this
lead us into a bear market next year? We don’t think that is likely unless the
US suffers a recession. While it doesn’t appear that we are heading for one, I
also recall at the start of 2000 and 2008 market experts didn’t expect a
recession or a bear market then either. I’m not looking to be right or wrong in
the call…just aware and prepared.”
This year we are thinking the opposite. We could very well
be in for a “blow-off top” that could propel the S&P 500 to $2600 to $2700
before entertaining the next bear market. A large part of our thinking
materializes from monetary and fiscal policy trends, global economic growth,
corporate earnings and technical analysis.
We believe that the US equity markets are chugging higher
more on investor sentiment than underlying fundamentals. Should we get
confirmation that expectations are becoming a reality then we could see the
next leg higher in the stock market. This will most likely happen as the
economy experiences a “sugar high” from continually accommodative monetary
policy and a burst of fiscal stimulus.
Fiscal Stimulus
The proposed infrastructure
spending plans by the Trump Administration may very well be a shot in the arm
for the US economy and set it on pace for more robust growth. According to a
recent spending priority list of Emergency & National Security Projects,
the plan is calling for an immediate $137.5 billion spending proposal that is
estimated to produce 193,350 direct job years and 241,700 indirect job years.
According to the McClatchy
DC web site, “The preliminary list,
provided to the National Governor’s Association by the Trump transition team,
offers a first glimpse at which projects around the country might get funding
if Trump follows through on his campaign promise to renew America’s crumbling
highways, airports, dams and bridges. The governor’s association shared that
list with state officials in December. The group told the officials the
projects on that list were “already being vetted.””
We are unsure if President Trump will meet his targeted 4%
GDP growth in the US if the rest of the global economy remains in its current
sluggish state, but certainly it is of our opinion that this type of spending
plan, if done correctly could boost our economy beyond the sluggish pace during
the previous administration. We reiterate that it needs to be done correctly as
it seemed President Obama’s fiscal stimulus into “shovel ready” projects never
really made it to the real economy but certainly boosted capital market
returns. This fiscal stimulus is expected to be different as can be seen in the
infrastructure trade in the stock market. Industrials, materials and those hard
economy cyclical sectors have rallied hard upon the Trump election. According
to recent reports, Democrats are preparing to release their own $1 trillion
infrastructure spending plan in the days to come. With bipartisan support of
fiscal spending (something the Republicans resisted during President Obama’s term)
there is a better than average chance that spending will increase. For fiscal
conservatives and limited government proponents, this is undoubtedly a hard
pill to swallow but should we see economic growth confirm expectations, that
would be a key driver of equities moving forward.
Other pro-growth policies such as tax cuts and deregulation
are also a tail wind for equity prices. According to JP Morgan (via Business
Insider), “Donald Trump’s
administration , backed by a Republican majority in both houses of Congress,
has unveiled a strongly pro-business, pro-growth agenda. While some
initiatives, such as cutting regulations and boosting infrastructure spending,
may take several years to impact the economy, the promise of tax reform has
already spurred a stock market surge.
Tax cuts for
businesses and households stand a strong chance of becoming law in early 2017,
as procedural rules make them far easier for Congress to pass than traditional
legislation. The GOP has largely coalesced around House Speaker Paul Ryan’s
“Better Way” plan, a comprehensive package of reforms designed to encourage
investment and promote growth.
The stock market
responded to the presidential election by climbing 7 percent in the fourth
quarter of 2016, creating almost $2 trillion in new wealth. This winter’s
anticipatory equities surge could be followed by a boost in GDP as the
implications of tax reform become clear. Nonpartisan tax economists estimate that
the planned stimulus could raise GDP by as much as 1 to 1.5 percentage points.”
Stronger Economic
Growth
We are seeing improvement in the US and global economic
picture. Sentiment aside, there are signs that the world is emerging from years
of lackluster economic growth. In the latest GDP report, the headline growth
figure of 1.9% 4Q16 was weaker than expected. That said, the New
Deal Democrat blog has brought to light several insights that point to
stronger growth ahead. They write, “This
morning's release of 4th Quarter 2016 GDP gives us our first look at several
long leading indicators for 2017: proprietors' income and real private
residential investment.
Let's turn first to
proprietors' income. One of the 4 long leading indicators identified by
Prof. Geoffrey Moore was corporate profits. The only problem with that
is, they aren't reported until the second estimate of GDP, which we will see next
month -- in other words, 2 to 5 months after the events have actually happened.
Proprietors' income almost but not quite always trends in the same
direction as corporate profits, and gets reported with the first estimate, so
it is more time.
In the 4th Quarter,
proprietor's income (blue), which unlike corporate profits (red), never turned
down in the last several years, continued to rise:”

“This tells us that
domestic US businesses with little exposure to foreign exchange issues continue
to improve their top lines. Now that the strong 2015 US$ has disspiated, he
likelihood is that corporate profits will follow. Needless to say, this
is a positive for the next 12 months.
Now let's turn to real
private residential investment. This is the long leading indicator
identified by Prof. Edward E. Leamer of UCLA in his presentation a decade
ago, "Housing IS the business cycle." The most accurate way to
measure this is as a share of overall GDP. This indicator typically turns
5 quarters before the economy as a whole turns. This morning it was also
reported to have increased:”

“Real private
residential investment declined in Q2 and Q3 from its Q1 peak, and whlle Q4
turned up, we still have not made a new high.
As of the end of 2016,
housing continued to give us a mixed picture. Both single family permits
and real residential construction, the two least noisy of all of the monthly
housing readings, have been rising:”

The Federal Reserve Bank of New York NowCast Report now
has 1Q17 GDP forecasts at 2.7% with the largest increases in growth coming from
the manufacturing sector.


The improvement in the manufacturing figures have been
astonishing. We blend several manufacturing reports into an aggregate reading. This
aggregate combines the various manufacturing surveys from all the regional
Federal Reserve banks into on easy to read model. Anything above zero
represents growth. The chart below shows the movement in our model over the
past several months.

On manufacturing, Scott Grannis of Calafia
Beach Pundit writes, “A
stronger-than-expected ISM manufacturing report helped get the stock market off
to a good start for the year.”

“As the chart above
shows, the ISM manufacturing index is pretty representative of strength in the
broader economy. Today's December ISM report is consistent with fourth quarter
GDP growth of 3-4%, and that is somewhat better than the market had been
expecting. The Atlanta Fed's GDPNow forecast for the fourth quarter had been
2.5%, and today it rose to 2.9%.”
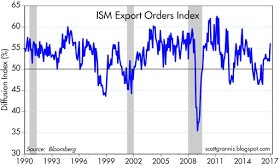
“Export orders, shown
in the chart above, were usually strong in December, a good sign that overseas
economic activity is picking up. It's also encouraging that export orders have
strengthened even as the dollar has strengthened (normally a stronger dollar
would be expected to make life more difficult for U.S. exporters). This further
suggests that animal spirits are rising both here and abroad.”

“The chart above
provides confirmation of this, in that it shows that manufacturing conditions
in both the U.S. and the Eurozone have improved quite a bit in recent months. A
synchronized strengthening of economic conditions around the world is a very
welcome development.”
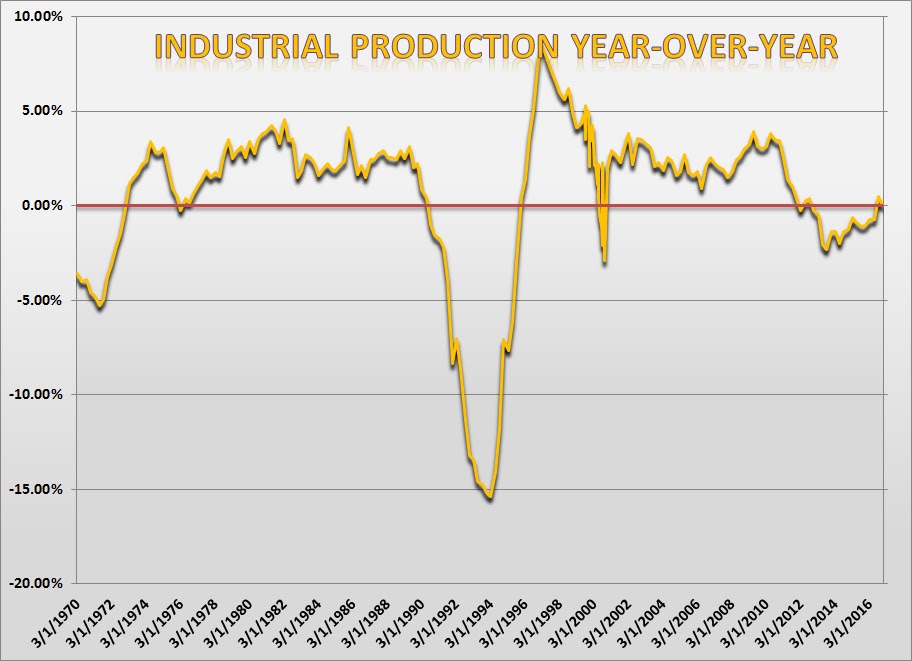
Industrial production and capacity utilization have improved
year-over-year.

According to the American Chemistry Council,
“American chemistry is essential to the
U.S. economy. Chemistry’s early position in the supply chain gives the American
Chemistry Council (ACC) the ability to identify emerging trends in the U.S.
economy and specific sectors outside of, but closely linked to, the business of
chemistry.
The Chemical Activity
Barometer (CAB), the ACC’s first-of-its kind, leading macroeconomic indicator
will highlight the peaks and troughs in the overall U.S. economy and illuminate
potential trends in market sectors outside of chemistry. The barometer is a
critical tool for evaluating the direction of the U.S. economy. The index
provides a longer lead (performs better) than the National Bureau of Economic
Research (NBER).”
“The Chemical Activity
Barometer (CAB), a leading economic indicator created by the American Chemistry
Council (ACC), started the year on a strong note, posting a monthly gain of 0.4
percent in January. This follows a 0.3 percent gain in December, November and
October. All data is measured on a three-month moving average (3MMA).
Accounting for adjustments, the CAB was up 4.6 percent over this time last year.
On an unadjusted basis the CAB climbed 0.3 percent in January, following a 0.5
percent gain in December.”


Retail sales year-over-year growth has broken its downward
trending pattern.

The Citigroup Economic Surprise Index has been trending up
with higher highs and higher lows.

The ratio of gold to lumber prices is also indicative of
stronger economic growth ahead and is a bullish sign for equities.


We are anticipating 3.1% to 3.3% US GDP growth this year. On
the global economic front, we anticipate Japan and Europe growing 1.5% to 1.7%
this year and China to post 6.0% to 6.5%. The business cycle is obviously
nearing its peak so we may see a pickup in productivity as capital investment
starts to pay off.
Normalized Monetary
Policy
As economic growth picks up and deflation themes erode, the
reflation trade and increase of inflationary pressures should prompt the Federal
Reserve to be more aggressive in their journey back to interest rate normalization.
Richard Bernstein from Richard
Bernstein Advisors writes, “However,
this past summer’s hackneyed theme of “lower for longer”, meaning that interest
rates would stay lower for longer than investors might expect, might prove to
be the swan song for the deflation investment theme. Secular global stagnation
and deflation probably ended last February, and our portfolios have been
positioned for improving nominal growth for much of 2016.”
As Trumponomics and additional global stimulus is enacted
this year, inflationary pressures will return after years of subdued readings. Bernstein
writes, “inflation expectations, measured
using the Fed’s supposed favorite measure of inflation expectations, actually
troughed last February. The upcoming administration has so far argued for the
largest Keynesian stimulus package since the Depression, and thus the upward
move in expectations for inflation and nominal growth has accelerated. The new
administration’s economic package might not match that promised during the
campaign, but it seems reasonable to assume that there will be more fiscal
stimulus rather than less, and that the positives of fiscal stimulus will be
greater than the potential negatives from the normalization of monetary policy
and rising interest rates.”

“The global economy
might still be in secular stagnation (although we are increasingly doubtful),
but cyclical acceleration is clearly underway. Leading economic indicators
(LEIs) around the world are strengthening in a unified manner that hasn’t
existed since the credit bubble.
Chart 6 shows the
relationship between the current global LEIs to those of three months ago. If a
country lies above the diagonal line in the chart, then the rate of change in
that country’s LEI is stronger than it was three months ago. If a country is
below the line, then the rate of change is deteriorating. Most LEIs are
improving in unison, which indicates broad improvement in the global economy
and an increasing chance of rising interest rates over the next year or so.”

“The slope of the
yield curve is one of the most reliable indicators of future nominal growth.
Steeper curves forecast faster nominal growth, flatter yield curves forecast
slower growth, and inverted yield curves forecast recession.
Global yield curves
are steepening, which supports the forecasts
of global leading indicators. Chart 7 shows the percentage of
global yield curves that are inverted
(i.e., forecasting a recession). In 2008, 41% of global yield curves were
inverted. Currently, it is only 2%. The
US yield curve, for example, has been steepening for 5 months.”

Scott Grannis of Calafia
Beach Pundit writes, “The December
CPI reading showed prices up 2.1% over the past year—the highest reading since
oil prices started to plunge beginning in mid-2014.”

“What happened with
oil and the CPI in the past few years was remarkably similar to what happened
in the mid- to late 1980s, when oil prices also collapsed and headline
inflation followed suit. Once oil prices stopped declining, as they eventually
did both times, then headline inflation jumped back up to where it was before
the oil price shock, as the chart above shows. To the extent that the world has
been worried about inflation being "too low" in recent years, it was
a mistake. Inflation has been alive and well all along.”

“The chart above is
remarkable, because it shows that there has been a very close relationship
between nominal GDP and the M2 measure of money supply for many decades. This
is why economists tend to prefer M2 above other measures of inflation: it's
demonstrated a fairly predictable relationship to nominal GDP over long
periods. But what is also apparent in the chart is the divergences of these two
dissimilar variables over the past few decades. M2 "undershot"
nominal GDP in the 1990s, and it "overshot" nominal GDP in the 2010s.
Currently it looks like there is about $2 trillion of "extra" money
sloshing around the U.S. economy. This is money that has for the most part been
stockpiled in bank savings deposits which pay very little interest and which
have more than doubled in the past 8 years (to almost $9 trillion currently).”

“As the chart above
shows, M2 is now about 70% of nominal GDP, whereas for over three decades it
tended to average about 57% of nominal GDP. The pronounced rise in the ratio of
M2 to GDP is symptomatic of a general increase in the world's demand for dollar
cash and cash equivalents. (M2 is comprised of currency, retail checking
accounts, time deposits, retail money market funds, and bank savings deposits.)
Not coincidentally, the dramatic rise in the demand for money has coincided
with a pronounced increase in risk aversion, as I've been noting repeatedly
over the years. But as I noted last week, small business optimism has improved
rather dramatically of late, and consumer confidence is on the rise as well.
And of course the stock market has hit new highs.
Optimism is making a
comeback, and that in turn suggests that the world's demand for money is not
going to continue to rise, and is more likely to begin to fall. If the demand
for money does begin to fall, then the rate of M2 growth is likely to slow
and/or the rate of nominal GDP growth is likely to pick up. Faster nominal GDP
growth would likely include some pickup in both real growth and inflation. With
inflation already running at 2% or so, any inflation pickup could—over the next
year or so—begin to flash warnings signs that the Fed is falling behind the
inflation curve.”
If the inflation picture and economic growth trajectory keep
pace or accelerate from the current levels, the Fed may be forced to increase
the pace of normalization. It will be
very interesting to see how the Bank of Japan and the European Central Bank
respond to these events. Both are in the throes of quantitative easing measures
and changing data points on a global scale may alter their current policies. In
our opinion this would impact foreign equity markets and put further pressure
on fixed income.
US Dollar
The US dollar broke to the upside upon the election of
Donald Trump. It has since pulled back. On the weekly chart, it appears 100 is
the support. That said, the MACD and several oscillators are heading lower. A
break below 100 could mean an extended downward path for the greenback.

On the monthly US dollar chart, we are seeing bearish
divergences everywhere. This could also spell a prolonged downturn for the US
dollar. Support would most likely be in the 92 range.

With US economic growth expected to outpace the global
average and the Fed embarking on a monetary tightening policy, it wouldn’t make
sense that the dollar is looking weaker. That said, if the global outlook
improves and inflationary pressures arise, many other central banks will need
to move much quicker than the Federal Reserve in that they never stopped their
monetary easing campaign while the Fed started their tightening policy. If the
Fed turns out to be ahead of the curve and many of their global counterparts
are forced into a rapid policy shift, that could have negative implications for
the US Dollar that has, in our opinion already priced global monetary dynamics.
President Trump has been speaking openly about the strength
of the dollar and has broken protocol of past administrations that were
supportive of a stronger dollar. According to CNBC,
“President-elect Donald Trump's shock
comment that the dollar is too strong suggests the U.S. is about to declare as
dead a two-decade policy of publicly favoring a strong currency.
"There's no
question that the Trump administration would not want a strong dollar. A strong
dollar does nothing good for whatever Trump is basically trying to do,"
said David Woo, Bank of America Merrill Lynch's head of global rates and
foreign exchange research. "Yes, the U.S. fundamental story is bullish for
the U.S. dollar, but the problem here is they actually don't want a strong
dollar. I think it's going to go up. However, it's going to be a much more
volatile climb."
Trump's remarks also
took a shot at one of the most crowded trades on the planet — long wagers on
the dollar. That trade has been a bet that Trump's policies will reflate the
economy, causing interest rates and the greenback to rise. But that dollar move
is at odds with building a more powerful American manufacturing base, because a
strong dollar makes exports more expensive for foreign buyers.”
We would not be going short the US Dollar, even though it’s
a fairly crowded long trade right now. But we do consider the weakening dollar
as a possibility and that would have a profound impact on corporate earnings.
Earnings Picture
The corporate earnings picture has improved greatly from
this time last year. As the next chart shows, the twelve-month forward earnings
per share projections for the S&P 500 have started to head higher after a
brief earnings recession last year.

The one month slope of earnings, a statistic we watch
closely for earlier indications of a market correction – bear market has
improved from last year as well and is solidly sloping positive.

Book value per share for the S&P 500 is heading higher
although cash flow per share seems to have leveled off. This could be an early
indication of earnings quality deterioration and we will monitor is closely.


With improving prospects of domestic economic growth, a stabilizing
global economy and a weaker US Dollar, the corporate profit picture has room to
run. Aggregate profit margins are off their peak from a few years ago, so
margin expansion that originates from new sales as opposed to financial
engineering is a very bullish sign for the stock market.
Market Technicals
On the long-term S&P 500 technical reading, it appears
we are out of the woods from the negative readings received last year. On the
monthly chart, we take a short bias in the market when the following steps
occur. First, we need to see a MACD bearish cross. Once that occurs we wait for
the index price to fall below its 20-month moving average and RSI to fall below
50. If the 20-month moving average slopes negative and the index retests and
fails, then we position ourselves for the bear market. The chart below shows
our warning signs (orange shaded area) and our bearish confirmation (red shaded
area). Once the MACD crosses bullish, we remove the short bias.
At the start of last year, we were receiving several signals
as a warning but never got the confirmation. The warning period (red box)
turned out to be a consolidation period only.

Now all the signals are telling us to remain long the
market.
Bottom Line: We
understand that the market is not cheap at these levels and stock appreciation
is being driven more by sentiment than by underlying fundamentals at this
point. We do not want to fight the current trend. There are conditions that
exist that we believe could drive the market 10% to 20% higher.
Fiscal Policy –
Proposed infrastructure spending by the Trump Administration, if deployed
correctly can provide a boost to economic growth and equity prices.
Economic Growth – We are
seeing signs of life from the manufacturing sector that seems to have been so
dormant for the longest time.
Monetary Policy – Any
tightening from this already accommodative policy will more than be offset by
introduced fiscal easing.
US Dollar and Profits
- A weakening US Dollar and an accelerating corporate profit picture will be
good for the stock market in our opinion.
Market Technicals –
We believe the longer-term S&P 500 chart has given us the confirmation (at
least temporarily) to be long the market.
Joseph S. Kalinowski,
CFA
Email: joe@squaredconcept.net
Twitter: @jskalinowski
Facebook: https://www.facebook.com/JoeKalinowskiCFA/Blog: http://squaredconcept.blogspot.com/
No part of this report may be reproduced in any manner
without the expressed written permission of Squared Concept Asset Management,
LLC. Any information presented in this report is for informational
purposes only. All opinions expressed in this report are subject to
change without notice. Squared Concept Asset Management, LLC is a
Registered Investment Advisory and consulting company. These entities may have
had in the past or may have in the present or future long or short positions,
or own options on the companies discussed. In some cases, these positions
may have been established prior to the writing of the report.
The above information should not be construed as a
solicitation to buy or sell the securities discussed herein. The
publisher of this report cannot verify the accuracy of this information.
The owners of Squared Concept Asset Management, LLC and its affiliated
companies may also be conducting trades based on the firm’s research
ideas. They also may hold positions contrary to the ideas presented in
the research as market conditions may warrant. This analysis should not be considered investment advice and may not be suitable for the readers’ portfolio. This analysis has been written without consideration to the readers’ risk and return profile nor has the readers’ liquidity needs, time horizon, tax circumstances or unique preferences been considered. Any purchase or sale activity in any securities or other instrument should be based upon the readers’ own analysis and conclusions. Past performance is not indicative of future results.


