Sunday, April 23, 2017

This Week's Reading


John P. Hussman 4/17/17 - The Value of Dry Powder

“The chart below shows the most reliable market valuation measure we identify, nonfinancial market capitalization to corporate gross value added, on an inverted log scale (blue line, left scale), along with the actual 12-year nominal annual total return for the S&P 500 Index (red line, right scale). As we observed during the severe market retreats that followed the tech bubble and the mortgage bubble, substantially higher expected returns are likely to emerge over the completion of this market cycle, as a result of interim losses in the next few years. Dry powder has considerable value here, not because of the return it currently generates, but because of the opportunity it may afford to establish constructive and even aggressive market exposure over the completion of this cycle, at higher prospective returns than are currently available. For that reason, whether investors choose hedged alternatives or cash, I strongly encourage investors to maintain a regular, disciplined saving plan.”


“Bank lending to consumers and businesses is slowing down.

As of last week, commercial and industrial lending had not increased since September 7, the first six-month period of declines since the aftermath of the financial crisis, Bank of America Merrill Lynch said.

Consumer-loan growth has also slowed, up by 1.4% since the November election versus 3.1% during the same period a year earlier.

Depending on who is asked, this slowdown is either an expected response to some preceding indicators or another reason to be worried about the economy.”


“The slowdown seemed to be a bit of a puzzle at the outset. One explanation, for businesses at least, was that they were awaiting the outcome of the election, and then of policies like tax reform and immigration, before deciding to borrow for big investments.

But that argument doesn't necessarily hold up for consumers, whose spending decisions are less reliant on Capitol Hill.”

“But from a business-lending perspective, the slowdown is a bit of a lagging indicator, considering the big drawdown in inventories last year, he said. Inventories, a major part of gross domestic product, slowed economic growth during much of 2015 and 2016.

Additionally, the first quarter was solid for bond issuance, suggesting that companies are relying less on bank credit, Baird said. High-grade companies issued a record $414.5 billion of debt in the first quarter, according to Dow Jones.

And from the supply side — why banks aren't lending as much — David Schawel, a fixed-income portfolio manager at New River Investments, argues that banks don't stand to miss out as much by not earning interest on lending.”


Mohamed A. El-Erian: Bloomberg View 4/19/17 - High Stock Prices and Low Bond Yields Can't Last

“Unless you believe the Federal Reserve will ease monetary policy, which I don't, it is getting harder to reconcile what are still historically low bond yields and relatively high stock prices. More consistent and sustainable levels probably lie somewhere in the middle. Exactly where, as well as when and how we would get there, depends primarily on the balance between geopolitical and economic-policy influences.

Stock markets repeatedly have proven extremely resilient in shrugging off both political and geopolitical worries. In doing so, they have relied on deeply anchored market beliefs regarding stable growth, supportive central banks and further liquidity injections. As a result, they view the prospects for stronger corporate earnings and economic growth as compensations for geopolitical fluidity.”


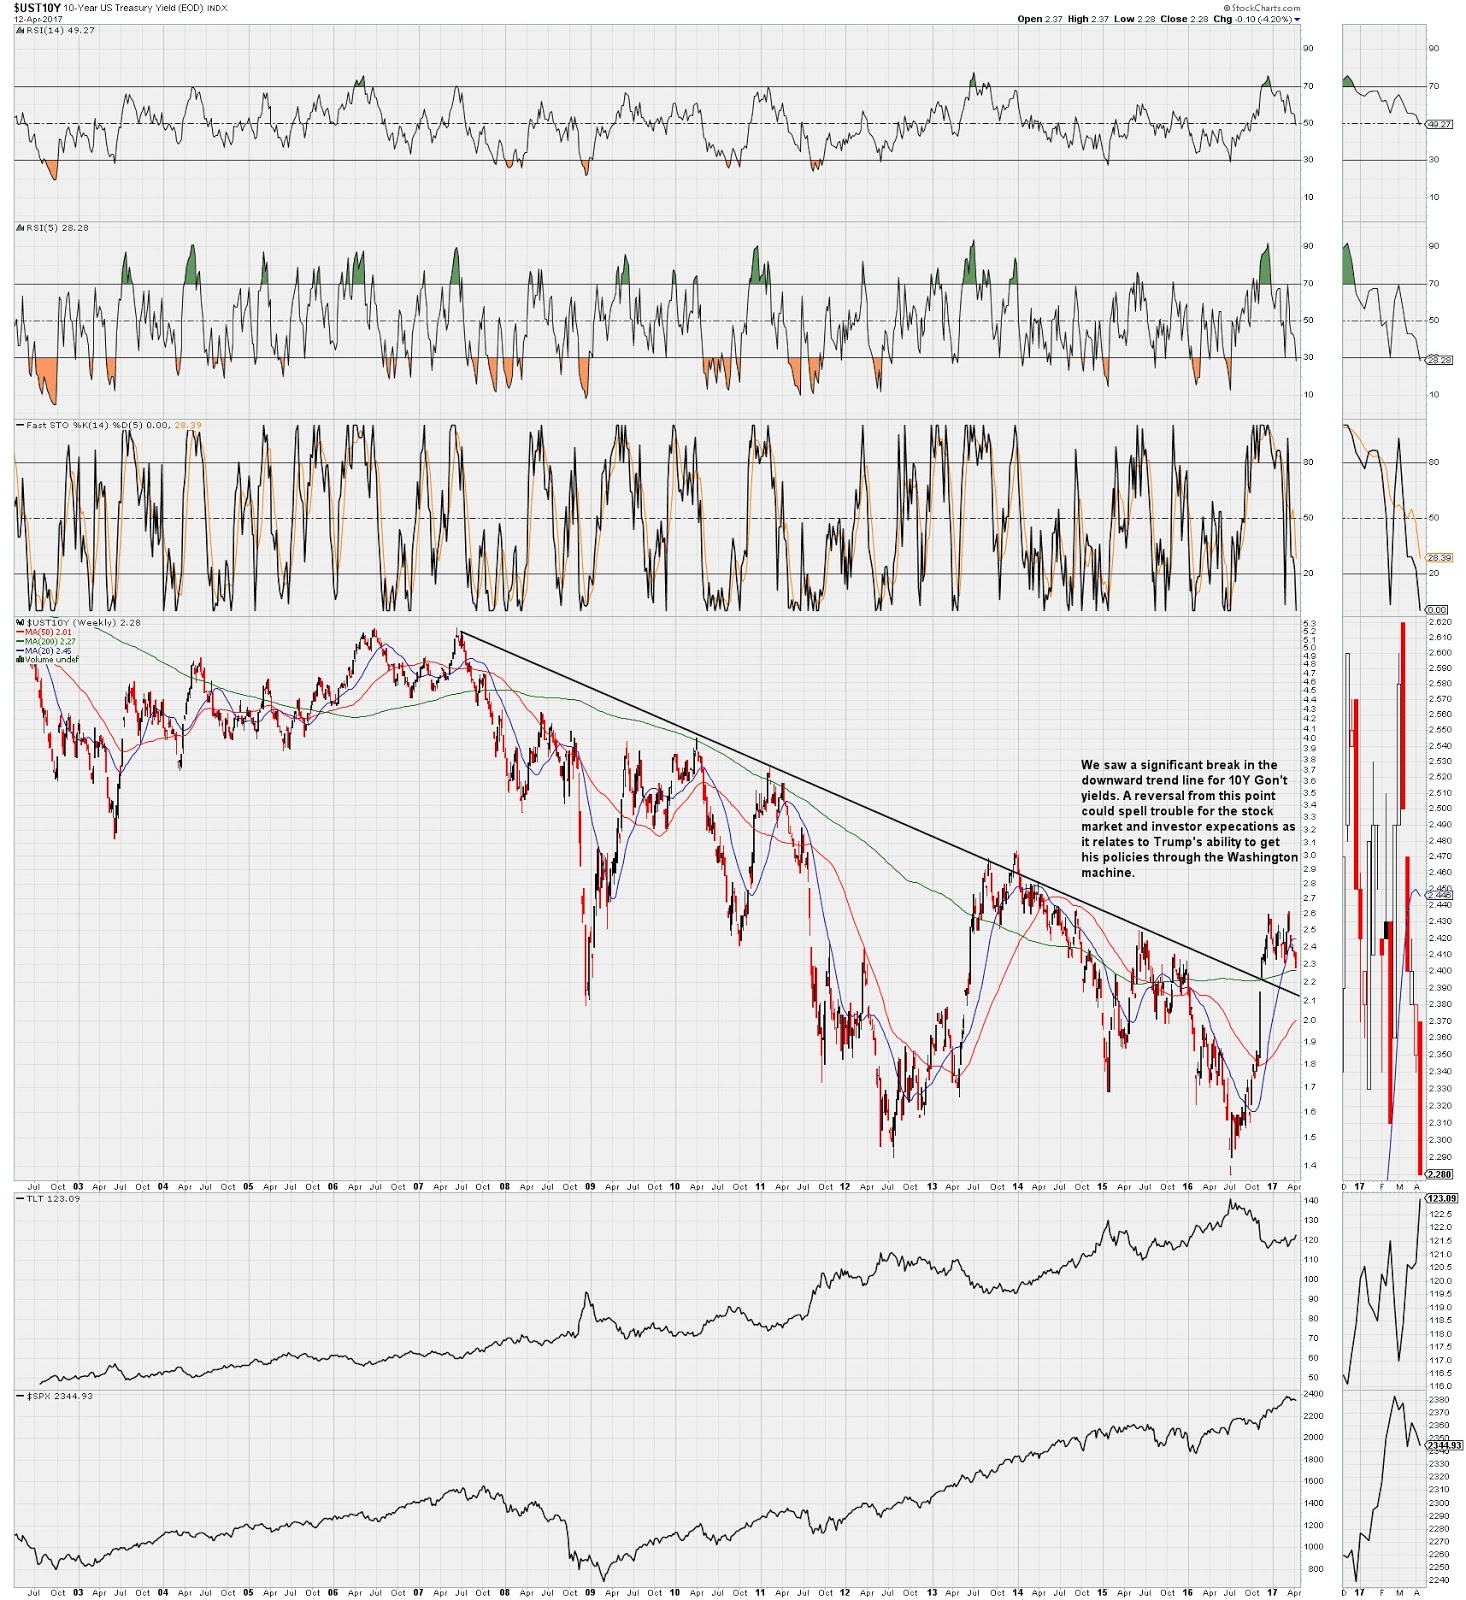
“The same isn't true of government bond markets. There, yields on 10-year Treasuries have languished recently below the 2.30–2.60 percent range that was established after the November presidential elections, as geopolitical worries have been compounded by concerns about both low inflation and subdued growth.

This is not the first time that government bonds and stocks have sent conflicting signals, and it won't be the last. Moreover, this inconsistency coexists with several others, including the divergence between emboldened measures of business/consumer confidence and hard data that remains sluggish.

Also, let us not forget the asymmetrical upside/downside prospects. Simply put, at current levels, stocks heavily dominate bonds when it comes to most current assessments of the upside return potential segment.


Yet this particular market inconsistency has persisted for some time, and it has outlasted many explanations, including those emphasizing the technical positioning of markets. Indeed, the only proper way to reconcile the two competing market signals at this stage is through a forecast of renewed monetary policy easing on the part of the Federal Reserve.

Absent a major economic downturn that would also rout stock markets, such easing is highly unlikely. Indeed, while the balance of risk may be shifting, the baseline still favors two additional interest rate hikes this year, together with an action plan for balance-sheet normalization.

The more likely outcome is a reconciliation of market signals with government bond yields moving up and stock prices down. When this happens, where the two settle, and the orderliness of the process will be mainly a function of two influences: the extent to which geopolitics has an adverse effect on the outlook for growth, and the extent to which U.S. policy reforms improve the prospects for actual and potential growth. In the meantime, investors should be increasingly wary about betting on durable market inconsistencies.”


“Yet by last week, nearly half of all stocks in the broad S&P 1500 were down at least 10 percent from their 52-week high, the popular bank sector remains down that much and economically attuned groups such as transportation and steel have lagged badly.

Since around the time of the market high, the 10-year Treasury yield has ebbed to 2.2 percent from 2.6 percent, the CBOE S&P 500 Volatility Index (VIX) has climbed into the 
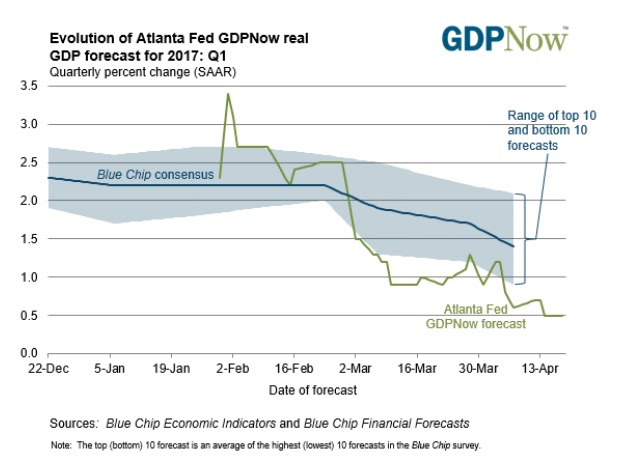
mid-teens from around 11 and the Atlanta Fed's GDPNow forecast model for 
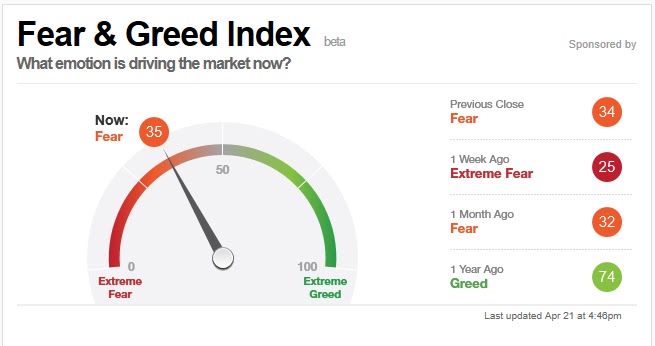
first-quarter growth has tumbled to 0.5 percent from 2.5 percent. Investor attitudes have also run from excessive bullishness to a warier outlook, with weekly investment-advisor polls, the CNNMoney Fear & Greed Index and the Bank of America Merrill Lynch Global Fund Manager Survey suggesting that the so-called wall of worry is gradually being rebuilt.


This subtle but noteworthy change in market character means we're again at a point where market handicappers are asking whether the market's internal weakness has been dramatic enough, with enough "oversold" conditions popping up, to set up a strong rebound. So far, according to close students of tactical market clues, the answer is "Close, but not quite."

Katie Stockton, technical strategist at BTIG, says last Thursday's high-volume sell-off sent some of her preferred indicators to extreme readings that often set up a good rebound. Yet, she concludes that "down-volume was strong enough to suggest the pullback still has a hold on the market." Confident that the longer-term market uptrend remains intact, she says, "We remain on the lookout for a buying opportunity, which appears more likely after a shakeout in high-beta areas of the market."

Similarly, BAML's Stephen Suttmeier sees this little downside reset in the market as incomplete. One notable shift is the arrangement of the short-term and longer-term VIX futures prices, with immediate volatility expectations appearing puffed-up relative to more distant ones. Without getting into the statistical weeds, it's another "oversold" condition, one that says traders are paying up aggressively for a possible sudden spike in market risk, despite the still-placid behavior of the indexes themselves.

While this is a start, Suttmeier argues that broader measures of downside hedging with options "are nowhere near the oversold levels that have coincided with important S&P 500 lows." He figures the index has another 2 to 4 percent of risk to the downside in the fairly near future based on the weight of the evidence.

The quirk this time is that when the VIX makes a five-month high (as it did in recent days), the S&P 500 is usually down a whole lot more than 2 or 3 percent from an all-time high. Does this mean traders are overreacting to modest weakness, or are the options guys foretelling a stormier period ahead? Worth watching is the corporate-credit market: It remains firm, but risk spreads have modestly widened in recent weeks, slightly weakening one of the stock market's key sources of strength in the past year.

Even the strongest years tend to have one or more declines of more than 5 percent from a high, so this would be consistent with the rhythm of an ongoing market advance – one that is strongly suggested, based on historical patterns, by the impressive start to the year. If the late-March lows were as deep as this quiet correction gets, it might be comforting, but it also likely means the market won't have built up sufficient fear or reloaded with enough fresh buying power to vault the market too quickly on a powerful new leg higher. This is often the trade-off traders face – muted volatility can contain the market in both directions for long stretches of time.”

OilPrice.com (via The Fiscal Times) 4/20/17 - Why the Oil Markets Are Headed for a ‘Decade of Disorder’.

“But investment fell by over $300 billion in the two-year period of 2015 and 2016 – “an unprecedented occurrence,” the IEA noted in a 2016 report on energy investment. 2017 could show marginal increases in spending, but the industry is not returning anywhere close to the pre-2014 levels of investment.

That could set the world up for a supply shortfall by the end of the decade when large deepwater projects that were not given the greenlight over the past three years would have started to materialize. The lack of new production will mean that suppliers struggle to keep up with demand.

Michael Cohen, head of energy markets research at Barclays, told the Platts Capitol Crude podcast that a supply shortfall could hit as soon as the 2020-2022 period, assuming annual oil demand growth of 0.8 to 1 mb/d, which is lower than the 1.3 mb/d of demand growth the IEA expects for this year. Of course, if demand grows each year at a more than 1 mb/d rate – not an unreasonable scenario – the supply shortage would be even more acute. “The question is whether the market will see that eventuality and try to price it in beforehand,” Cohen said on the Platts podcast. “It is our view that prices need to rise” in order to incentivize new supply coming online to cover that eventual gap, he added.


“The Brent physical oil market is flashing signs of weakness again as dwindling Asian purchases, an influx of American crude to Europe, and supplies flowing out of storage all combine to recreate a glut in the North Sea.

The weakness comes at a time when speculators have started rebuilding bullish positions after a sell-off last month, betting the market will tighten in the second quarter. Yet, Brent physical oil traders say the opposite is happening so far, according to interviews with executives at several trading houses, who asked not to be identified discussing internal views.

“We need to see the market going really into deficit for oil prices to rise,” Giovanni Staunovo, commodity analyst at UBS Group AG in Zurich, said. “If this is temporary, it could be weathered, but it needs to be monitored.”

The weakness is particularly visible in so-called time-spreads -- the price difference between contracts for delivery at different periods. Reflecting a growing surplus that could force traders to seek tankers as temporary floating storage facilities, the Brent June-July spread this week fell to an unusually weak minus 55 cents per barrel, down from parity just two months earlier. The negative structure is known in the industry as contango.”


“In the world of contracts for difference, which allow traders to insure price exposure for their North Sea crude shipments week-by-week, the one-week CFD spread plunged this week to minus $1.84 a barrel, the weakest since late November and just before the Organization of Petroleum Exporting countries and allied nations announced their first joint effort to manage supply in over a decade. A month ago, the comparable CFD traded at just minus 50 cents barrel.

"It will not take much before we see headlines about floating storage starting to increase again," said Olivier Jakob, head of oil consultant PetroMatrix GmbH, in Zug, Switzerland.”

“The differentials between physical grades and benchmarks have also weakened in recent weeks. Glencore Plc, the world’s largest commodities trader, on Thursday bought from French oil giant Total SA a cargo of Brent crude at $1 a barrel below the main North Sea benchmark, the widest discount in 22 months, according to a trader monitoring deals.

Oil traders said OPEC was initially successful, driving oil prices higher and tightening time-spreads. But the group was a victim of its own success, as those same spreads forced crude out of storage, flooding an already weaker physical market with supply. Higher headline prices also boosted U.S. shale producers.”


“Through April 13, only 30 percent of the 148 subindustries in the S&P Composite 1500 stock index were trading above their 10-week, or 50-day, moving averages, noted Sam Stovall, chief investment strategist at CFRA Market Advisor. “While this is certainly an indication of recent weakness, it may also be viewed as a source of near-term optimism, since it implies that the market may be oversold,” argued Stovall.

He also noted that in any given week since Dec. 31, 1995, 60 percent of the subindustries in the S&P 1500 traded above their 10-week moving average. And whenever S&P 1500 had 30 percent or fewer of its subindustries trading above their 10-week averages, the S&P 1500 outpaced its average for all periods over the coming three, six, and nine weeks. “Indeed, the S&P 1500 rose in price 1.5 percent, 2.7 percent and 3.5 percent during the subsequent three, six and nine weeks after touching 30 percent or lower,” Stovall pointed out.

And if you’re worried that the market may weaken further, you have more gains to look forward to, he added. That’s because whenever the percentage declined to 25 percent or less, the S&P 1500 improved during the following three, six and nine weeks, rising 1.7 percent, 3.2 percent and 4 percent, respectively, and posting higher frequencies of advance during all periods.”


Joseph S. Kalinowski, CFA


Twitter: @jskalinowski

Facebook: https://www.facebook.com/JoeKalinowskiCFA/

Blog: http://squaredconcept.blogspot.com/

Tumblr: trader-rants


No part of this report may be reproduced in any manner without the expressed written permission of Squared Concept Asset Management, LLC.  Any information presented in this report is for informational purposes only.  All opinions expressed in this report are subject to change without notice.  Squared Concept Asset Management, LLC is a Registered Investment Advisory and consulting company. These entities may have had in the past or may have in the present or future long or short positions, or own options on the companies discussed.  In some cases, these positions may have been established prior to the writing of the report. 

The above information should not be construed as a solicitation to buy or sell the securities discussed herein.  The publisher of this report cannot verify the accuracy of this information.  The owners of Squared Concept Asset Management, LLC and its affiliated companies may also be conducting trades based on the firm’s research ideas.  They also may hold positions contrary to the ideas presented in the research as market conditions may warrant.


This analysis should not be considered investment advice and may not be suitable for the readers’ portfolio. This analysis has been written without consideration to the readers’ risk and return profile nor has the readers’ liquidity needs, time horizon, tax circumstances or unique preferences been considered. Any purchase or sale activity in any securities or other instrument should be based upon the readers’ own analysis and conclusions. Past performance is not indicative of future results.


Alpha Prime Trade Journal for the Week Ended 4/21/17


Closed Positions


Joseph S. Kalinowski, CFA

Email: joe@squaredconcept.net

Twitter: @jskalinowski
Facebook: https://www.facebook.com/JoeKalinowskiCFA/

Blog: http://squaredconcept.blogspot.com/

Tumblr: trader-rants

No part of this report may be reproduced in any manner without the expressed written permission of Squared Concept Asset Management, LLC.  Any information presented in this report is for informational purposes only.  All opinions expressed in this report are subject to change without notice.  Squared Concept Asset Management, LLC is a Registered Investment Advisory and consulting company. These entities may have had in the past or may have in the present or future long or short positions, or own options on the companies discussed.  In some cases, these positions may have been established prior to the writing of the report. 

The above information should not be construed as a solicitation to buy or sell the securities discussed herein.  The publisher of this report cannot verify the accuracy of this information.  The owners of Squared Concept Asset Management, LLC and its affiliated companies may also be conducting trades based on the firm’s research ideas.  They also may hold positions contrary to the ideas presented in the research as market conditions may warrant.

This analysis should not be considered investment advice and may not be suitable for the readers’ portfolio. This analysis has been written without consideration to the readers’ risk and return profile nor has the readers’ liquidity needs, time horizon, tax circumstances or unique preferences been considered. Any purchase or sale activity in any securities or other instrument should be based upon the readers’ own analysis and conclusions. Past performance is not indicative of future results.


Alpha Prime Trading Model


Program Objectives: The Alpha Prime algorithmic trading platform a discretionary portfolio dedicated to providing superior returns on investments in all market conditions.  The objective is capital appreciation and growth. The portfolio aims to achieve a high absolute rate of return by utilizing proprietary metrics in applied mathematics and technical analysis. 

This is a long / short strategy, buying highly liquid securities to achieve our desired performance results. Taking into consideration concentration risk, we will be utilizing a mix of long/short securities to mitigate systemic and idiosyncratic risk.

The Alpha Prime algorithmic trading platform is based on the belief that a diligent and nimble investor can take advantage of short- and medium-term market inefficiencies. Opportunistic trading can produce profits for our investors and manage the risk of overall market movements.

Program Rules: The basic underlying mathematical premise behind the trading methodology assumes a highly mean-reverting strategy and directional momentum bias. We intend on deploying a maximum of 5% of the total portfolio buying power per trade to mitigate concentration risk. We will maintain stop-losses per trade that equate to no more than 0.5% of the unlevered portfolio value. Margin will be used. To mitigate portfolio volatility, we will maintain a downside beta neutral strategy. Our profit objective is a gain within 5 - 15 days.

Security Selection Criteria: We will only buy those securities that are highly liquid and trade above a certain dollar amount. For the purposes of this program we will be buying securities that trade more than 1,000,000 shares daily at a price above $20.00.

Momentum Bias: The decision to be long or short the security will depend on its individual momentum bias and that of the momentum bias of the general market (S&P 500).

Long Candidates

The securities to be considered are as following:

·        20-day exponential moving average > 50-day exponential moving average

·        50-day exponential moving average > 200-day exponential moving average

·        Slope of the 200-day exponential average > 0

·        SCTR > 90 (will go as low as 75 if warranted)[1]

The momentum indicators in the SCTR used to determine directional bias include:

·        Percent above/below its 200-day exponential moving average

·        125-Day rate-of-change

·        Percent above/below 50-day exponential moving average

·        20-day rate-of-change

·        3-day slope of PPO-Histogram

·        14-day RSI

We prefer to see a security rank in the strongest 10% of its peers prior to going long. For short candidates, we prefer the security to rank in the bottom 10% of its peers. 


Short Candidates

The securities to be considered are as following:

                    20-day exponential moving average < 50-day exponential moving average

                    50-day exponential moving average < 200-day exponential moving average

                    Slope of the 200-day exponential average < 0

                    SCTR < 10 (will go as high as 25 if warranted)

We prefer to see a security rank in the strongest 10% of its peers prior to going long. For short candidates, we prefer the security to rank in the bottom 10% of its peers. 

Target Candidates

A security will be targeted as a potential trade depending on the slow stochastics %K (5,1)[2] reading.

%K (5) = ((Current Close - Lowest Low)/ (Highest High - Lowest Low) * 100) t-5

%D (1) = 1-day SMA of %K


Lowest Low = lowest low for the look-back period

Highest High = highest high for the look-back period

%K is multiplied by 100 to move the decimal point two places


If the above listed long criteria are met, then a long candidate is targeted when slow stochastics %K (5,1) < 20.

If the above listed short criteria are met, then a short candidate is targeted when slow stochastics %K (5,1) > 80.

The Trigger

Buy a long candidate near the close of trading when slow stochastics %K (5,1) rises above 20.

Sell a short candidate near the close of trading when slow stochastics %K (5,1) falls below 80.

Exiting the Trade

The following rules will be used to exit a trade.

For long positions:

Sell the position when the daily slow stochastic %K (5,1) rises above 80 and the stock price is below the 20-day exponential moving average.

or

If above the 20-day EMA, sell 1/2 position when the daily slow stochastics %K (5,1) rises above 80. The 20-day EMA becomes your stop for the remainder of the position. Sell on the open of the day after it breaches to the downside if the stock opens lower than the 20-day EMA. If it opens higher than the 20-day EMA, the 20-day EMA becomes your intra-day stop.

or

When the stock closes below the predetermined stop loss. Sell at the start of the next trading day if the stock opens below the stop loss. If the stock opens above the stop loss level, sell intra-day if the level is breached.


For short positions:

Cover the position when the daily slow stochastic %K (5,1) falls below 20 and the stock price is above the 20-day exponential moving average.

or

If below the 20-day EMA, sell 1/2 position when the daily slow stochastics %K (5,1) falls below 20. The 20-day EMA becomes your stop for the remainder of the position. Cover on the open of the day after it breaches to the upside if the stock opens higher than the 20-day EMA. If it opens lower than the 20-day EMA, the 20-day EMA becomes your intra-day stop.

or

When the stock closes above the predetermined stop loss. Cover at the start of the next trading day if the stock opens above the stop loss. If the stock opens below the stop loss level, cover intra-day if the level is breached.

Maintaining a market neutral position.

At the close of trading each day we examine our total beta-neutral long/short bias within the portfolio. We will utilize overnight protection against adverse price swings using derivatives or ETF’s. This will mitigate systemic risk versus unforeseen events when the market is closed. 

On an intraday basis, we will close the beta-neutral hedge if the market (S&P 500) opens higher. 

If the 200-minute simple moving average is breached to the downside and the S&P 500 is turns negative during trading, beta-neutral hedges will be redeployed. They will be removed should the market recover above the 200-minute simple moving average and the market goes positive. 

If the market (S&P 500) opens lower we will maintain the over-night downside beta-neutral hedge until the point where the market goes positive on the day and a break to the upside on the 200-minute simple moving average occurs.


The breach above or below the 200-minute moving average will be confirmed by a movement in the MACD Histogram (1,200,20) one standard deviation above or below the mean over a 200-minute time span.

Position Size.

We will calculate the 90-day variance for each security that we add to the portfolio. We will deploy assets to the position equal to the minus one standard deviation downside that coincides with our total portfolio downside risk of 0.5% of the unlevered portfolio value.

Trade Example:


Joseph S. Kalinowski, CFA

No part of this report may be reproduced in any manner without the expressed written permission of Squared Concept Asset Management, LLC.  Any information presented in this report is for informational purposes only.  All opinions expressed in this report are subject to change without notice.  Squared Concept Asset Management, LLC is a Registered Investment Advisory and consulting company. These entities may have had in the past or may have in the present or future long or short positions, or own options on the companies discussed.  In some cases, these positions may have been established prior to the writing of the report. 
The above information should not be construed as a solicitation to buy or sell the securities discussed herein.  The publisher of this report cannot verify the accuracy of this information.  The owners of Squared Concept Asset Management, LLC and its affiliated companies may also be conducting trades based on the firm’s research ideas.  They also may hold positions contrary to the ideas presented in the research as market conditions may warrant.

This analysis should not be considered investment advice and may not be suitable for the readers’ portfolio. This analysis has been written without consideration to the readers’ risk and return profile nor has the readers’ liquidity needs, time horizon, tax circumstances or unique preferences been considered. Any purchase or sale activity in any securities or other instrument should be based upon the readers’ own analysis and conclusions. Past performance is not indicative of future results.


[1] The StockCharts Technical Rank (SCTR) is a numerical score that ranks a stock within a group of stocks. The methodology for these rankings comes from the wisdom of John Murphy, author of many books on technical analysis and contributor to the Market Message at StockCharts.com. Stocks are assigned a score based on six key indicators, which cover different timeframes. These indicator scores are then sorted and assigned a technical rank.
[2] Developed by George C. Lane in the late 1950s, the Stochastic Oscillator is a momentum indicator that shows the location of the close relative to the high-low range over a set number of periods. According to an interview with Lane, the Stochastic Oscillator “doesn't follow price, it doesn't follow volume or anything like that. It follows the speed or the momentum of price. As a rule, the momentum changes direction before price.” As such, bullish and bearish divergences in the Stochastic Oscillator can be used to foreshadow reversals. This was the first, and most important, signal that Lane identified. Lane also used this oscillator to identify bull and bear set-ups to anticipate a future reversal. Because the Stochastic Oscillator is range bound, is also useful for identifying overbought and oversold levels.

Trade Journal for the Week of 4/23/17 - French Elections

Emmanuel Macron and Marine Le Pen through to second the round in French politics. I suppose the doomsday scenario has been avoided as EUR/USD has jumped to 1.0909 and the JPY/USD is down to .0091. Risk-on trades, so I imagine the results of the election in France will not derail the current rally (although Brexit and the Trump election didn't have any lasting damage).

If we get a tax reform proposal out of the Trump administration, strong corporate earnings results and avoid a government shut-down this coming week we could see the market propel to new highs.

On FX.


We'll see how the European markets react to today's election results.


Would like to see financials improve this week.


Stocks we're watching.


Joseph S. Kalinowski, CFA

Email: joe@squaredconcept.net

Twitter: @jskalinowski
Facebook: https://www.facebook.com/JoeKalinowskiCFA/

Blog: http://squaredconcept.blogspot.com/

Tumblr: trader-rants

No part of this report may be reproduced in any manner without the expressed written permission of Squared Concept Asset Management, LLC.  Any information presented in this report is for informational purposes only.  All opinions expressed in this report are subject to change without notice.  Squared Concept Asset Management, LLC is a Registered Investment Advisory and consulting company. These entities may have had in the past or may have in the present or future long or short positions, or own options on the companies discussed.  In some cases, these positions may have been established prior to the writing of the report. 
The above information should not be construed as a solicitation to buy or sell the securities discussed herein.  The publisher of this report cannot verify the accuracy of this information.  The owners of Squared Concept Asset Management, LLC and its affiliated companies may also be conducting trades based on the firm’s research ideas.  They also may hold positions contrary to the ideas presented in the research as market conditions may warrant.

This analysis should not be considered investment advice and may not be suitable for the readers’ portfolio. This analysis has been written without consideration to the readers’ risk and return profile nor has the readers’ liquidity needs, time horizon, tax circumstances or unique preferences been considered. Any purchase or sale activity in any securities or other instrument should be based upon the readers’ own analysis and conclusions. Past performance is not indicative of future results.


Thursday, April 20, 2017

Trade Journal - A Few Potential Trades to Consider

As far as the general US stock market is concerned, we are in a "sleepy correction". It just feels heavy and unsatisfying. A few days (weeks) of panic selling are what we are looking for to get excited about the buying opportunities.


Looking at our various "panic" measures, it feels like we are getting close to a buying opportunity but the lack of panic isn't convincing. We're still looking for the next stage of violent selling to start buying aggressively.


On metals - We're looking for the steel industry to find a base here and a return of upward momentum. We own Steel Dynamics in the portfolio and are looking at other opportunities in the sector once things settle.


Copper has broken down from its symmetrical triangle pattern and looks to be heading to $2.45. Further deterioration in the economic outlook as well as President Trump's ability to push through his agenda will impact copper prices from its coming support, in our opinion. If we reach support and bullish momentum returns...we'd go long the metal (JJC).


Gold has broken out but should be pulling back a bit. Increased geo-political uncertainty (North Korea - China and French elections) have supported gold. There are decreasing expectations of an overly hawkish Fed that could also be pushing gold higher. Tapping the brakes on monetary policy and unremarkable fiscal policy will add support. If the copper trade doesn't come to fruition we believe the gold trade will.


On FX - Looking for potential set-ups in the British Pound, Canadian Dollar, and the US Dollar. Nothing to trade yet but keeping a close eye out for opportunity.


On US stocks - took a position in PKG and sold AIG for a loss.


Other stocks I'm watching.


Joseph S. Kalinowski, CFA

Email: joe@squaredconcept.net

Twitter: @jskalinowski
Facebook: https://www.facebook.com/JoeKalinowskiCFA/

Blog: http://squaredconcept.blogspot.com/

Tumblr: trader-rants


No part of this report may be reproduced in any manner without the expressed written permission of Squared Concept Asset Management, LLC.  Any information presented in this report is for informational purposes only.  All opinions expressed in this report are subject to change without notice.  Squared Concept Asset Management, LLC is a Registered Investment Advisory and consulting company. These entities may have had in the past or may have in the present or future long or short positions, or own options on the companies discussed.  In some cases, these positions may have been established prior to the writing of the report. 


The above information should not be construed as a solicitation to buy or sell the securities discussed herein.  The publisher of this report cannot verify the accuracy of this information.  The owners of Squared Concept Asset Management, LLC and its affiliated companies may also be conducting trades based on the firm’s research ideas.  They also may hold positions contrary to the ideas presented in the research as market conditions may warrant.


This analysis should not be considered investment advice and may not be suitable for the readers’ portfolio. This analysis has been written without consideration to the readers’ risk and return profile nor has the readers’ liquidity needs, time horizon, tax circumstances or unique preferences been considered. Any purchase or sale activity in any securities or other instrument should be based upon the readers’ own analysis and conclusions. Past performance is not indicative of future results.


Thursday, April 13, 2017

Trade Journal - Risk Off Trades are Breaking Out


More signs of waning confidence in the economy and the Trump Administration. Yesterday was yet another “risk-off” day but it would appear that we are starting to break out in many sectors that would indicate additional weakness to come.


On the Trump Administration.

President Trump gave an interview to the Wall Street Journal. One can see why the actions of his policy positions can cause jitters in the market. It’s one thing to hold a core position and alter that position as your view changes. It’s a completely different thing to flip positions entirely. If I were to say I used to drink coffee with milk and sugar but I’ve changed to drinking it black. My core liking of coffee remains intact but I’ve changed position on the periphery. If I were to say I love coffee last week but say I hate coffee this week – that’s a sign of instability and uncertainty. Two things the market does not appreciate.

President Trump on Chair Yellen yesterday (Business Insider)…“Janet Yellen may not be done as the Federal Reserve chair just yet.

President Donald Trump told The Wall Street Journal that he was undecided to bring Yellen back as Fed Chair after her term expires in 2018, saying she is "not toast."

"I like her, I respect her," Trump said. "It's very early."

Trump called out Yellen multiple times during his campaign, saying the Fed's low interest rate policy was hurting the economy, in addition to accusing the central bank of colluding with former President Obama, Hillary Clinton, and the Democratic Party…In terms of Fed policy, Trump admitted to the Journal that he is a fan of low interest rates.

"I do like a low-interest rate policy, I must be honest with you," the president said.”

President Trump on Chair Yellen six months ago (Business Insider) … “Republican presidential candidate Donald Trump is going after Janet Yellen again, claiming that the Federal Reserve is creating an investment bubble.

During the first presidential debate, Trump said that the economy is having "the worst revival of an economy since the Great Depression" and that nothing in the country is healing after the financial crisis.

Additionally, Trump said that because of record low interest rates from the Fed, the country's economy is "in a big, fat, ugly bubble," with debt increasing while the "only thing that looks good is the stock market."

Thus when interest rates increase, the bubble would burst and the stock market would crash.

Trump also repeated his claims that the Fed is keeping interest rates low while President Barack Obama is in office in order to keep the economy going until Obama leaves office.”

What about China? I can recall the thousands of times Trump bashed the Chinese trade policies in every debate, stump speech and interview he had given during the campaign. It was almost laughable the number of times he attacked China. It was truly one of the staples of his campaign.

Back in June this is what was reported by Time, “At the end of the speech, Trump turned to a favorite topic: China. The final three points of Trump's seven-point trade plan concern China's "currency [manipulation]" and "theft."

First, "I am going to instruct my Treasury Secretary to label China a currency manipulator. Any country that devalues their currency in order to take advantage of the United States will be met with sharply," Trump said. Ad-libbing, he continued, "And that includes tariffs and taxes." This marked a sharp break from Republican orthodoxy of the last several decades, which is to oppose new taxes during election campaigns.

Trump argued that "China's entrance into the World Trade Organization has enabled the greatest jobs theft in history." According to the McKinsey Global Institute, the U.S. lost about 1/3rd of its manufacturing base between 2000 and 2010, some 6 million jobs, as TIME recently reported. Only about 700,000 were lost to China, through 'tradable' areas like apparel and electronics.

Trump also said, "If China does not stop its illegal activities, including its theft of American trade secrets, this is very easy. This is so easy, I love saying this. I will use every lawful presidential power to remedy trade disputes, including the application of tariffs, consistent with Section 201 and 301 of the Trade Act of 1974 and Section 232 of the Trade Expansion Act of 1962."”

Now…” Trump, in an interview with the Wall Street Journal on Wednesday, appeared to acknowledged that China hasn’t been intervening to weaken its currency recently. “They’re not currency manipulators," he said.”Newsmax.

How about his thoughts on the monthly employment figures? On the campaign trail, “Trump repeatedly claimed during the campaign that the federal government was understating the real unemployment rate.

"Don't believe these phony numbers," Trump told supporters early last year. "The number is probably 28, 29, as high as 35 [percent]. In fact, I even heard recently 42 percent." - NPR

But after a solid jobs report in February – a full month in office, President Trump switched stances. “On Friday, many eagerly waited to see how Trump would characterize February’s stellar jobs report. He retweeted the Drudge Report’s take, which characterized the latest jobs report as “GREAT AGAIN.”

The White House Press Secretary, Sean Spicer, didn’t mince words at a press conference Friday afternoon when Eamon Javers, a reporter for CNBC, brought up Trump’s previous doubts about the report’s veracity. “Does the president believe that this jobs report was an accurate and a fair way to measure the economy?” Javers asked. In response, Spicer said, “I talked to the president prior to this, and he said to quote him very clearly. They may have been phony in the past, but it’s very real now.”” [emphasis ours]The Atlantic

Really?

Someone needs to get a handle on the Trump Doctrine so market participants know where he is going to land. Until then, reckless tweets and mixed signals will not help the stock market.

On Yields Analysis.

Take a look at treasuries yields. The 10Y yield has started to deteriorate and has fallen back below 2.3%. This does not bode well for the equity markets or the markets confidence in the economic picture looking forward.


The yield curve has started to aggressively flatten and the 30Y treasury prices relative to stock prices have start moving in a direction that is painful for the stock market.


The chart below compares the prices of investment grade bonds (AGG) to speculative grade bonds (HYG) on a monthly basis. When this relative price comparison is in an uptrend (above its 5-month exponential moving average), equity returns have suffered. It seems we are about to see the cross above the 5-month moving average. We would stay out of the market should we see this trend continue.


On Metals.

Gold is breaking out. Not a great sign for the economy and perhaps a response to increased global tensions (China moving 150,000 troops to the North Korea border).


Copper and steel prices are tumbling and breaking down. Another blow to the reflation trade theory.


The gold to copper ratio is heading in the wrong direction.


The markets.

The breakdown in financials and small caps continue to be worrisome.


The S&P 500 looks set to fall a bit further. The VIX is showing inversion now but still can head higher…a bad sign for the market. We’d like to see a little more “panic” in the market before getting comfortable deploying additional assets. We usually would like to see inversion accompanied by a +50% price move in the VIX and a spike in the Put/Call ratio. The past, a combination of these events usually marks a good buying opportunity – assuming the economy isn’t heading for a recession.


Utilities are taking off. This is a “risk-off” trade that doesn’t bode well for the economy and confidence in the Trump Administration.


We consider the Japanese Yen as a risk-off measure. It too is breaking out.


The strong US dollar will also put a damper on things should it continue to strengthen. It seems President Trump understands this. Yesterday he tried to talk down the dollar. From Bloomberg, “The dollar slumped and Treasury bond yields dropped to the lowest level this year after President Donald Trump said he will not brand China a currency manipulator and added that the greenback was getting too strong. U.S. stocks declined for a second day as volatility climbed again across asset classes.

The Bloomberg Dollar Spot Index fell as much as 0.4 percent after Trump made the comments in an interview with the Wall Street Journal on Wednesday, abandoning a core promise of his election platform that tapped into voter anger about trade-driven job losses.”


“The remarks are seen as reducing the risk that China could dump its holding of Treasuries in retaliation for being tagged a currency manipulator. China’s currency traded outside of the country gained the most since last month.”

Even with the US dollar pull-back yesterday…it’s still trading near the top end of its range.


Bottom Line: This is a discouraging market. Every indication signals to US market weakness ahead. We have positions in the market with hedges in place. We also don’t feel confident enough to completely short the market because a single tweet or some encouraging event can spark the next rally. The bull market remains intact so shorting outright (as opposed to hedges) is a risky proposition.

We continue to wait for a better entry point to deploy assets. For now – we just block and tackle.

Joseph S. Kalinowski, CFA


Email: joe@squaredconcept.net

Twitter: @jskalinowski
Facebook: https://www.facebook.com/JoeKalinowskiCFA/

Blog: http://squaredconcept.blogspot.com/

Tumblr: trader-rants


No part of this report may be reproduced in any manner without the expressed written permission of Squared Concept Asset Management, LLC.  Any information presented in this report is for informational purposes only.  All opinions expressed in this report are subject to change without notice.  Squared Concept Asset Management, LLC is a Registered Investment Advisory and consulting company. These entities may have had in the past or may have in the present or future long or short positions, or own options on the companies discussed.  In some cases, these positions may have been established prior to the writing of the report. 


The above information should not be construed as a solicitation to buy or sell the securities discussed herein.  The publisher of this report cannot verify the accuracy of this information.  The owners of Squared Concept Asset Management, LLC and its affiliated companies may also be conducting trades based on the firm’s research ideas.  They also may hold positions contrary to the ideas presented in the research as market conditions may warrant.


This analysis should not be considered investment advice and may not be suitable for the readers’ portfolio. This analysis has been written without consideration to the readers’ risk and return profile nor has the readers’ liquidity needs, time horizon, tax circumstances or unique preferences been considered. Any purchase or sale activity in any securities or other instrument should be based upon the readers’ own analysis and conclusions. Past performance is not indicative of future results.