
Short Term Trading
Comment
I re-read Tony Robbins book Money – Master the Game this weekend. Towards the end of the book
he writes about his interviews with some of the most successful traders in the
world and drew a few conclusions. The one that stands out to me is, “All these masters, while driven to deliver
extraordinary returns, are even more obsessed with making sure they don’t lose
money. Even the world’s greatest hedge fund managers, who you’d think would be
comfortable taking huge risks, are actually laser focused on protecting their
downside.”
Given the market volatility lately we are updating our
trading action more frequently than we may have in previous blog posts. Our
goal is to minimize drawdowns in the portfolio and mitigate risk by attempting to
survey the perils that exist before us. We believe the market is at a
crossroads currently and there is a trend shift in place. These are the most
challenging times to trade in our opinion.
During trending markets, bullish or bearish, momentum indicators
work best. Buying the dips was the call over the past many years. Short
positions were far and few and held with tight stops and quick profit taking
measures. During 2015 the market became trendless, i.e. a flat market. During
this period sentiment indicators and oscillators with finite upper and lower
bound action points worked best. That’s how most of our gains were made last
year. The tricky part to trading is realizing when you are switching from a
trendless market to a directional trending bias. We believe we are at a
trend-turning point for the US equity markets (we reference the S&P 500,
other indices have been in a bear market for some time now i.e. energy,
materials, transports and small caps).
We wrote last week in our blog post Trading
Thesis for 2016 - Initial Thoughts, “We
are trading for a brief relief rally from last week. We think it may prove
short lived as the VIX data and weekly charts aren’t really confirming a rally
(I could be wrong as I was in October). Should we get a relief rally, we'll
keep the stops tight and will most likely be in 100% cash quickly waiting for a
blood in the streets selloff scenario.”
We had taken a very small long position at the close on
Friday January 8th knowing we didn’t have all that much conviction
on the trade. Monday and Tuesday rolled around with lousy attempts to rally. On
Wednesday morning (January 13th) the market popped higher at the
open. As soon as the oil inventory figures were released that morning and we
saw oil futures immediately take a nosedive we decided to close all our long
positions for a small gain. We’ve been in cash since as the market resumed its
downward trajectory. Better to sit this one out.
The traditional buy the dip indicators didn’t hold this time
around and as Lance Roberts from Real
Investment Advice points out, “With
the markets having issued multiple sell signals, broken very important support
and both technical and fundamental deterioration in progress, it is suggested
that investors use these ‘snap back’ rallies to reduce equity risk in
portfolios.”
I reiterate this point
because the market continued to slide on Wednesday which led to several
comments about the inability of the markets to get a sellable bounce. There is
an important “truism” to remember.
“Markets crash when
they’re oversold.”
Let’s step back and
take a look at the past two major bull markets and subsequent bear market
declines.”

“The top section of
the chart is a basic “overbought / oversold” indicator with extreme levels of
“oversold” conditions circled. The shaded area on the main part of the chart
represents 2-standard deviations of price movement above and below the
short-term moving average.
There a couple of very
important things to take away from this chart. When markets begin a “bear
market” cycle [which is identified by a moving average crossover (red circles)
combined with a MACD sell-signal (lower part of chart)], the market remains in
an oversold condition for extended periods (yellow highlighted areas.)
More importantly,
during these corrective cycles, market rallies fail to reach higher levels than
the previous rally as the negative trend is reinforced. All of these conditions currently exist.
Does this mean that
the markets will go straight down 20% without a bounce? Anything is possible. However, history suggests that even during
bear market cycles investors should be patient and allow rallies to occur
before making adjustments to portfolio risk. More often than not, it will
keep you from panic selling a short-term market bottom.”
We’ve posted the next chart several times in the past few
months as it bears mentioning from time to time. The long-term chart of the
S&P 500 is exhibiting similarities today that existed at the start of the
previous two bear markets. Here are the technical steps that occurred
previously. (1) The MACD (20, 35, 10) line passed through the signal line to
the downside; (2) prices dropped below their 20 month moving average; (3) the
RSI (14) broke below 50; (4) the slope of the 20 month moving average turned
negative; (5) the market rebound to test the 20 month moving average as
resistance only to fail and (6) the RSI (14) retested the 50 level and failed.
We have currently seen 1 through 4 occur. It is our belief that if we are
unable to get back above the 20 month moving average and the 50 RSI (14) level,
the S&P 500 can continue to sell-off to around 1600. That marks the top of
the previous two bull markets and the 38.2% Fibonacci retracement from the 2009
lows.

We do believe that most of our profits this year will be
made on the short side of the market. That said we certainly could see a bounce
back to the 20 month moving average this quarter. The weekly S&P 500 is
oversold everywhere. RSI, stochastics, percent above 50 and 200 day moving
average, percent having a bullish point and figure formation and percent new
high/low are all in -2 standard deviation territory. What’s really compelling
to us on this chart though is the possible MACD bullish divergence that appears
to be taking shape. The S&P 500 has closed lower than its August lows but
the MACD remains higher than its levels last August. If we could get some type
of rally here and the weekly MACD starts to head higher we believe it could be
a rather strong reflex rally before headed lower again.

As we continue to wait on the sidelines we’ll be looking for
a significant rally on very strong volume and a follow through rally within a
few trading days of that before venturing out to start building a long position
again. We’d get much more aggressive if indeed the weekly MACD exhibited a
bullish divergence. If it continues to drop we’ll continue to wait, we don’t
have the desire to short at these levels and remaining in cash with profits
booked for January isn’t so bad right now.
Hope…
There is quite a crowd of professionals that would scoff at
our trading thesis. For many the bull market remains intact and the buy the dip
strategy holds. These are extremely smart and successful traders and investors
so we must listen to their rationale to avoid various behavioral biases that we
are all susceptible to. It has been said repeatedly that economic data coming
out of the auto and housing sector as well as solid employment figures show
that we are far-removed from a looming US economic recession. Without the clear
and present threat of a recession then a full blown bear market will most
likely not materialize. Cam Hui from Humble
Student of the Markets writes, “During
these times of market turmoil, I ask myself if any of the following triggers
for a bear market are in place:
Are we facing a war or
revolution that will cause the permanent impairment of capital (e.g. Russian
revolution, World War II, US Civil War, etc.)?
Is a recession on the
horizon?
Is the Fed being overly
aggressive and tightening the US economy into a recession?
The answer to the
first question is obviously no.
I also see minimal
risk of a US recession (see my Recession Watch page). Using the framework used
by New Deal democrat’s approach of adopting the Geoffrey Moore long leading
indicators, recession risk is low. As well, Georg Vrba`s work also comes to a
similar conclusion.
As for the third
question, the Fed is just starting a tightening cycle and they have made it
clear that they plan on being slow and gradual. Moreover, various Federal
Reserve officials have indicated that they are tolerant of inflation being
slightly over target in order to bring the economy back to full employment. So
the Fed can hardly be characterized as being aggressive.
In short, the triggers
for a bear market are not there.”
We’ve been reading Humble Student of the Markets for quite
some time and Cam Hui has written many market based opinions with sound
reasoning and brilliant clarity so we take his viewpoints quite seriously.
According to Cam Hui, “But
what`s spooking the markets? I can summarize the worries as:
- Geopolitics: The North Korean H-bomb test and rising tensions between Saudi Arabia and Iran;
- China; and
- Slowing growth.”
From Business
Insider, “In a note to clients late
Friday, Goldman Sachs Chief Economist Jan Hatzius argues that incremental
deterioration in China should have littel impact on the developed, western
world.
“If China does slow
more seriously, how big are the spillovers to DM growth?” Hatzius asks.
“Probably not very big. The reason is illustrated in Exhibit 1, which plots
exports to China, as well as more broadly to Asia ex-Japan, as a share of GDP.
With the exception of Australia, Japan, and Germany, all of the China numbers
are around 1%. This means that even if Chinese import volumes were to decline
by 10% across the board due to a combination of Chinese domestic demand
weakness and CNY depreciation—a very severe assumption—this would only take 0.1
percentage points off DM GDP growth directly.””

From Business
Insider, “Despite the bloodbath,
David Kelly, chief global strategist for JP Morgan Funds, isn't worried yet…To
Kelly, whether to sell comes down to five questions, which are (with Kelly's
answers):
- Is the downturn in oil and/or the Chinese economy enough to drag the US economy with it? No, since the US consumer and services are enough to overcome the weakness.
- Are we near or in a recession? No, employment is still gaining, and most indicators people are pointing too are technical and removed from the real picture.
- Will earnings rebound? Yes, as the effects of a stronger dollar and low oil are lapped.
- Are interest rates low? Yes, 0.25% is still historically low.
- Are valuations too high? No. He believes they're right around to the long-term average.
The answers to the
questions indicate strong fundamentals are still intact, according to Kelly.
This means that, soon enough, investors are going to give in to the other fear
in the market: Fear of the market going up without them.
"If you get in
now, you'll still have an opportunity to make big gains," said Kelly.
"So investors are going to start realizing that valuations are low right
now, and they don't want to miss out when they go back up."
In turn, as more and
more people start to buy back into the market, prices will increase, and the
seemingly sinking stocks will be afloat again.”
From Tim
Duy's Fed Watch, “So what I am
looking for when it comes to a recession? It's not a recession until you see it
economy wide in the labor markets. When it's there, you will see it everywhere.
Clearly, we weren't seeing it in the final quarter of last year. But, you say,
employment is a lagging indicator, so last quarter tells you nothing. Not nothing,
I would say, but a fair point nonetheless. One would need to look for the
leading indicators within the employment data.
First, since the
manufacturing sector is the proximate cause of these recession concerns, we
would look to leading indicators in that sector. One I watch is hours worked:”

“Hours worked are off
their peak, just as prior to the 1900 and 2001 recessions, but not the 2007
recession (lagging indicator that time). But hours also dropped in 1994, 1998,
2002, and 2005. And that would be an extra four recessions that didn't happen.
To add a bit more confusion, hours works are coming off a peak not seen since,
sit down for this, World War II:”

“OK, not much more
promise. Best as a leading indicator ahead of 2001, not counting 1994 and 1998.
Not particularly useful for 1990 and somewhat useful ahead of 2007. On balance,
I would say manufacturing hours worked data is necessary but not sufficient for
a recession call.
Perhaps the JOLTS data
offers something more:”

“Unfortunately we a
working with only two cycles here, and then only barely so. But it seems
reasonable that manufacturing hires might be a coincident indicator (maybe
leading by the few data points ahead of the 2001 recession) and
layoffs/discharges a lagging indicator. But if a manufacturing
"recession" were underway, then we would expect hiring to drop off
quickly here.
Quits, however looks
like a leading indicator:”

“Looks like quits in
manufacturing dropped sharply ahead of 2001, modestly during 2007, but were
still rising at the end of 2015. If quit rates aren't dropping among those at
the front lines, the pain can't be reaching recessionary levels just yet.
But manufacturing is
just one sector of the economy - just 8.8% of employment. The real hypothesis
the recessionists are proposing is that manufacturing is an indicator of an
economy wide shock. Here I would say the JOLTS data is less supportive:”

“If we are entering a
recession, firms are a minimum should be pulling back on the pace of hiring. We
are not seeing that yet. And workers should be wary of quitting:”

“Again, the workers
are on the front lines of the economy. If the economy is in trouble, they know
it, and quit rates start declining. Not there yet.
I also have a soft spot
for the temporary help series as it as rolled over twelve months or more ahead
of the last two recessions:”

“So if we were to see
temporary help roll over now, we would still not see recession until 2017.
And finally, there is
initial jobless claims, which typically lead a recession by six to twelve
months:”

“Not seeing it. If
claims started rising now, and continued rising for six months, then the
probability of recession would rise sharply, and if they rose continuously for
twelve months, the probability of recession would approach 1. But now? Nothing
to fear.
Bottom Line: From a
labor market perspective, I am not seeing conclusive evidence of an impending
recession in manufacturing, let alone the overall economy. Might be at the tip
of one, but even that will take a year to evolve. I have more sympathy for the
view that the economy has evolved into a mid-late to late stage of the cycle,
and the transition and associated uncertainty results in some not-surprising
volatility in financial markets.”
Scott Grannis from Calafia
Beach Pundit also makes the case that we are not heading into a recession.
He writes, “For all the turmoil out
there, it's remarkable that the prices of gold and 5-yr TIPS remain in a
downward trend. (Note: I use the inverse of TIPS's real yields as a proxy for
their price.) If conditions were really unravelling, the market would be paying
ever-higher prices for these two safe haven assets. They were much higher in
price in late 2011 and 2012 when the PIIGS crisis was at its apogee. That
crisis threatened the economies of the eurozone and the euro itself. The
current crisis is much more narrowly defined.”

“Sharply lower oil prices
have dramatically increased the risk of default for energy-related corporate
debt, as shown in the blue line in the first chart [below]. But the threat of
defaults is concentrated in the energy sector. Non-energy high-yield debt
credit spreads are only 660 bps, much less than half the 1600 bps spreads on
energy-related bonds, and less than the spreads on all HY debt at the peak of
the PIIGS crisis. As the second chart [below] shows, swap spreads are very low,
in sharp contrast to how they behaved in previous recessions. Very low swap
spreads tell us that financial markets are highly liquid and that systemic risk
is very low. This is mostly a problem affecting the oil patch, not everybody.”


Despair…
On the other hand there are some very ominous predictions by
traders and investors that we equally respect that paint a completely divergent
picture. On Dana
Lyons' Tumblr he writes, “Specifically,
the S&P 500 has now dropped over 9% in the past 2 weeks. Despite that, the
VIX has risen to just 25.22. Since 1987 (the VIX’ inception was in 1986), there
have been 129 days on which the S&P 500 was down as much as 7% over the
past 2 weeks. Today’s VIX reading is the lowest of any of those days.”

“So what gives? Is
this a sign of relative complacency despite the sharp market losses? That is a
reasonable thesis, especially upon quantitative examination. Looking at the
prior 128 days that showed a 2-week S&P 500 decline of at least 7%, just 15
had a VIX reading of less than 34. Now, this 34 level is an arbitrary number,
but it seems about as good a delineating level as any.”
“In general, these
occurrences led to further weakness in stocks. Indeed, despite the big drop
already, these conditions often marked a point closer to the beginning of a
decline than an ending. Whether it was immediately (e.g., the crash in 1987,
September 2001 or early August 2011) or a few weeks and months later, further
weakness was the norm. The 2010 dates really represent the exception as the
market would rebound immediately. Excluding that period, however, here are some
statistic on the S&P 500′s performance going forward.”

“As you can see, the
results don’t paint a very rosy picture, despite the fact that the S&P 500
has already taken its licks. So does the “complacency” explanation hold water
here. We’re not sure – nor do we really care. All we really care about are the
cold, hard numbers. And if history is any guide, investors, who have
demonstrated a rather complacent reaction to the decline so far, may very well
get a wake up call before this slump has run its course.”
We came across this tasty morsel during our weekly reading
in Business
Insider, “On Wednesday stocks got
crushed and officially entered a "correction," defined as a 10% drop
from recent highs.
This is the second
time in the past six months that this has happened — remember, stocks fell 10%
in August in just a few days — and these two corrections in such a short time
don't look good, historically.
Any single correction
isn't, in and of itself, a problem, but the speed with which stocks dropped
into correction territory almost back-to-back has been seen only three other
times in the past 100 years.
And these are not
years that market historians want to hear: 1929, 2000, 2008.”
“For less historically
inclined readers, each of these years saw major market crashes: One led to the
Great Depression, another saw the air come out of the tech bubble that ushered
in a new millennium, and one led to the Great Recession.
The S&P 500 fell
more than 10% in each of these years and dropped 38% in 2008 alone. The 1929
and 2000 events were followed by more brutal years.”
Warnings from several high profile names in the industry
surfaced this week. From BloombergBusiness,
“Global markets are facing a crisis and
investors need to be very cautious, billionaire George Soros told an economic
forum in Sri Lanka on Thursday.
China is struggling to
find a new growth model and its currency devaluation is transferring problems
to the rest of the world, Soros said in Colombo. A return to positive interest
rates is a challenge for the developing world, he said, adding that the current
environment has similarities to 2008.
Global currency, stock
and commodity markets are under fire in the first week of the new year, with a
sinking yuan adding to concern about the strength of China’s economy as it
shifts away from investment and manufacturing toward consumption and services.
Almost $2.5 trillion was wiped from the value of global equities this year
through Wednesday, and losses deepened in Asia on Thursday as a plunge in
Chinese equities halted trade for the rest of the day.
“China has a major
adjustment problem,” Soros said. “I would say it amounts to a crisis. When I
look at the financial markets there is a serious challenge which reminds me of
the crisis we had in 2008.””
On CNBC
Dennis Gartman pointed out, “Despite
infamously reversing his bearish stance on stocks late last year only to be
proven wrong, influential investor Dennis Gartman told CNBC that he believed
that a bear market has "begun in earnest globally" this time.
Turmoil in Chinese
stocks, a spike in gold and continued declines in oil markets are just some of
the reasons to believe that a bear market has begun, according to Dennis
Gartman, the editor and publisher of "The Gartman Letter"”
From Business
Insider, Jeffrey Gundlach states, “"Remember
how everyone felt when the market dropped over 350 points just yesterday?
You'll feel more scared before mid-year," said Jeffrey Gundlach, who runs
DoubleLine Capital. He does not see a 2008-scenario repeating itself. "It
is always different," he said. "But it's bad." Gundlach said the
stock and credit markets will struggle during the first half of this year but a
good buying opportunity will occur later in 2016.”
From the same article,
“Veteran short-seller Bill Fleckenstein said the downward trajectory in the
stock market began when the Fed's bond-buying program ended in October
2014.”This is definitely a bear market," he said. "They don't usually
put a neon sign that says, 'Get the hell out of town.'"
Forecasting
Recessions
We just wanted to point out the obvious dichotomy of two
opposing views in a highly volatile market environment. While our outlook on the market may be a bit
sanguine, our views towards an economic meltdown as seen in previous bear
markets remain highly suspect. That said we are not in the business of offering
economic projections or stock market forecasts for that matter. Our job is to attempt
to capture a trading trend or find an investment that offers significant value.
Forecasting the economy and the stock market is extremely difficult and certainly
above my pay grade. To highlight the difficulty in economic forecasting we
suggest reading Economicus
Terra Incognita from Mauldin Economics.
John Mauldin points out, “Morgan
Housel of The Motley Fool skewered Wall Street’s annual forecasting record in a
story last February. He measured the Street’s strategists against what he calls
the Blind Forecaster. This mythical person simply assumes the S&P 500 will
rise 9% every year, in line with its long-term average.
The chart below show’s
Wall Street’s consensus S&P 500 forecast versus the actual performance of
the S&P 500 for the years 2000–2014.”

“The first thing I
noticed is that the experts’ collective wisdom (the blue bars) forecasted 15
consecutive positive years. The forecasts differ only in the magnitude of each
year’s expected gain.
As we all know (some
of us painfully so), such consistent gains didn’t happen. The new century began
with three consecutive losing years, then five winning years, and then the 2008
catastrophic loss.
The remarkable thing
here is that forecasters seemed to pay zero attention to recent experience.
Upon finishing a bad year, they forecasted a recovery. Upon finishing a good
year, they forecasted more of the same. The only common element is that they
always thought the market would go up next year.
Housel calculates that
the strategists’ forecasts were off by an average 14.7 percentage points per
year. His Blind Forecaster, who simply assumed 9% gains every year, was off by
an average 14.1 percentage points per year. Thus the Blind Forecaster beat the
experts even if you exclude 2008 as an unforeseeable “black swan” year.”
He goes on to note the challenges of economic forecasting as
well by noting the deficits experienced by the Fed. “A 2015 study by Kevin J. Lansing and Benjamin Pyle of the San
Francisco Federal Reserve Bank found the FOMC was persistently too optimistic
about future US economic growth. They concluded:
Over the past seven
years, many growth forecasts, including the SEP’s central tendency midpoint,
have been too optimistic. In particular, the SEP midpoint forecast
(1) did not anticipate
the Great Recession that started in December 2007,
(2) underestimated the
severity of the downturn once it began, and
(3) consistently
overpredicted the speed of the recovery that started in June 2009.
So, it isn’t just Wall
Street that wears rose-colored glasses – they are fashionable at the Fed, too.
Lansing and Pyle provide helpful charts to illustrate the FOMC’s
overconfidence. This first one covers the years 2008–2010.”

“The colored lines
show you how the forecast for each year evolved from the time the FOMC members
initially made it. Note how they stubbornly held to their 2008 positive growth
forecast even as the financial crisis unfolded, then didn’t revise their 2009
forecasts down until 2009 was underway – and
then revised them too
low. However, they did make a pretty good initial guess for 2010, and they
stuck with it.
The next chart shows
FOMC forecasts for 2011–2013.”

“We see a different
picture in this chart. As of October 2009, FOMC members expected 2011 and 2012
would both bring 4% or better GDP growth. Neither year ended anywhere near
those targets. Their initial 2013 forecast was near 4% as well. They reduced it
as the expected recovery failed to materialize, but as in 2009, they actually
guessed too low.”
The Congressional Budget Office hasn’t fared much better. “If the Fed can’t accurately forecast the
economy, can anyone? Surely someone in the federal government has better
answers.
The Congressional
Budget Office issues forecasts much as the Federal Reserve does. And like the
Fed, the CBO grades itself. You can see for yourself in “CBO’s Economic
Forecasting Record: 2015 Update.”
Read that document,
and you will find the CBO readily admitting that its forecasts bear little
resemblance to reality. Their main defense, or maybe I should say excuse, is
that the executive branch and private forecasters are even worse.
I’m not kidding. The
CBO report includes the following chart. I removed other categories they
measure so we can look specifically at their GDP estimates. I should also point
out that they cooked the books a little by averaging two-year forecasts to make
themselves look better. But even so…”

“The bars compare the
degree of error in forecasts by the CBO, the Office of Management and Budget
(OMB), and the private Blue Chip economic forecast consensus. A reading of zero
would mean the average forecasts matched reality. A negative number would mean
they were too pessimistic. A positive number – which is what we see for all three
entities – means they were all overly optimistic on GDP growth.”
This is proof that even the greatest minds in the industry
are taking what amount to educated guesses. I can’t quantify the next statement
as I’m going by memory but I don’t recall many analysts and strategists calling
the end of the bull markets at their peaks in 1999/2000 and 2007/2008. In fact
I remember writing an article in June of 2000 that basically said the party was
over. The dot.com phenomenon had hit a wall and I listed several companies that
weren’t going to be in business in the next year or two. It was entitled RealityCheck.com
and boy was I a lone figure on this side of the call. I caught tremendous heat
from peers and superiors about my lack of understanding of the market dynamics
of the time. As John Mauldin points out, the Federal Reserve not only failed to
predict the recessions in 1990, 2001 and 2007 but they were slow to recognize
them once they took hold.
On the Economy
This past week we had retails sales and industrial
production releases. For retail sales, both the headline number and the details
contained were less than stellar. Indeed year-over-year retail sales have been
trending lower. For industrial production it fell 0.4% in December, more than
expected. This is prompting some strategists to warn of a potential drag on
4Q15 GDP.

From GDPNow
from the Atlanta Fed, “The GDPNow model
forecast for real GDP growth (seasonally adjusted annual rate) in the fourth
quarter of 2015 is 0.6 percent on January 15, down from 0.8 percent on January
8. The forecast for fourth quarter real consumer spending growth fell from 2.0
percent to 1.7 percent after this morning's retail sales report from the U.S.
Census Bureau and the industrial production release from the Federal Reserve.”

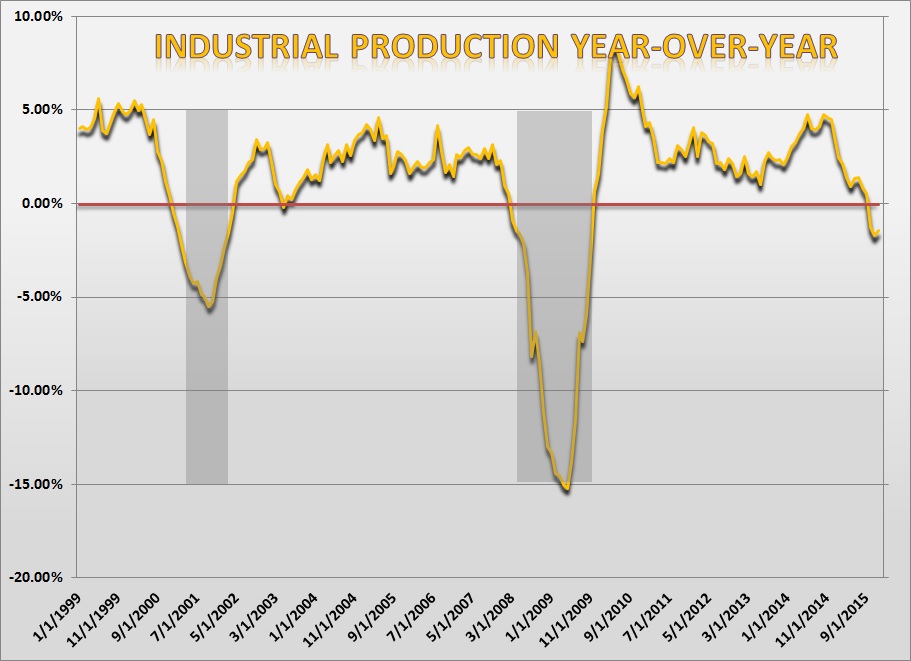
From Wolf
Street, “And the final shoe to drop
today, in a gratuitous sort of way, was the Federal Reserve’s index for
industrial production. It fell 0.4% in December, after having already fallen
0.9% in November and 0.2% in September, while August had been flat.
Year-over-year, December was down 1.8%.
A year-over-year drop
of this magnitude (-1% or more) has been linked to a recession every time it
occurred over the past six decades. You have to dig into the early 1950s before
you find the last two occurrences where this kind of drop in industrial
production was not associated with a recession.
I circled those two
exceptions in this chart by the Economics and Strategy team at NBF. I also
circled December’s drop. The recessions are the gray columns. This is starting
to look ugly:”

“Worse: contagion is
spreading from beaten-down oil & gas and metals & mining to consumer
goods, where production dropped 0.8% for the month, the fourth month in a row
of declines, though they still eked out a gain of 0.3% year-over-year. And it’s
hitting production of Business Equipment, down 0.8% year-over-year.”
Manufacturing in America continues to wane. The New York
Fed's Empire State Manufacturing Survey index tumbled to -19.37 in January from
-6.21 in December. While many write off the manufacturing sector as a trivial
economic indicator the following graphic (via Business
Insider) showing the manufacturing sectors impact of domestic economic
growth is hard to ignore.

What we try to do is keep an open mind that while the
current data isn’t echoing recessionary levels, the current economic climate,
both domestically and globally is tentative at best and it is of our opinion
that economic or corporate earnings “shocks” could be enough to ignite a
precipitous decline in these metrics.
Earnings Season
With earnings season upon us we will look for specific
trends to assist us in deciphering a labyrinth of open questions as to market
direction. On valuation, the S&P 500 is expected to earn $125.06 EPS in the
coming twelve months which gives it an earnings yield of 6.7%, according to
Bloomberg estimates. If we were to use a longer-term business cycle average
yield of 7.2%, then we would guess that the S&P 500 on an earnings basis is
roughly 7% overvalued from the mean. When using the balance sheet for the
S&P 500 for valuation purposes, as per Bloomberg the index currently has
$740.90 book value per share or a 39.4% yield compared to its longer term
average of 40.6%. If we were to use this value metric we would fathom the market
to be 3.6% over-valued. If we wanted to use the statement of cash flows as a
value measure, once again the ever valuable Bloomberg terminal tells us the
S&P 500 has a trailing twelve month $186.30 cash flow per share thus
yielding 9.9%. Using an average 10.8% cash flow yield would put the S&P 500
7.8% over valued.
If we were to take the three value metrics and weight them
by their twelve month correlation to prices we would come up with a blended
“smart” fair value. We put smart in quotes because there is absolutely no way
of accurately predicting where the S&P 500 price will be in the coming
twelve months. If it were that easy the market would be boring. We find it so
odd that many strategists and analysts all over CNBC go out there to try to
come up with a 2016 S&P 500 price target. We suppose its good TV but why
bother. We instead use it as a frame of reference on a static level and track
the second derivative rate of change on a dynamic level. Sudden and extreme
changes in this figure will raise red flags and be used as a warning tool in our
market model tool box.
(E/Y PT*E/Y
Wght)+(BV/Y*BV/Y Wght)+(CF/Y*CF/Y Wght)= “smart fair value”.
Where:
E/Y PT is the
expected price target derived from the income statement
E/Y Wght is the
correlation accuracy weight
BV/Y is the expected
price target derived from the balance sheet
BV/Y Wght is the
correlation accuracy weight
CF/Y is the expected
price target derived from the statement of cash flows
CF/Y Wght is the
correlation accuracy weight
(1745.86*.3395) +
(1812.15*.3334) + (1732.77*.3270) = $1763.51 or 6.2% over valued.
There you have it. Our price target for the S&P 500 by
the end of 2016 is $1763.51. Our version of Powerball madness I suppose. Check
back tomorrow, it will be different.

All kidding aside while that static number may not provide
much insight on future stock prices the directional and rates of change of each
component is very important. Here are a few items we’ll be watching for in the
coming earnings season.
EPS Directional Bias
The direction of earnings forecasts have a fairly tight
correlation with the direction of equities so the one month slope of the
earnings forecast line is useful to watch. Bear in mind forecasted earnings are
a reactionary lagging indicator so by the time you actually pick up a negative
reading in the slope of earnings, the market has already given up a lion’s
share of its gains and you’ll be a day late and a dollar short. Tracking the
rate of change in this figure has some use though. The slope of the line has a
natural tendency to be positive (as does the stock market) so by tracking the
rate of change, we could get a warning even if the slope of the trend is
positive but decelerating. This may lead to a bit of noise and false readings
but we look at it as a “head’s up” for potential problems. The chart below
shows a z-score for the one month slope of twelve month forward forecasts going
back twenty years.

When the z-score falls below zero, it indicates decelerating
or negative slope and should be used as a warning signal. If the figure
recovers quickly then we breathe a sigh of relief and move on with our investment
and trading thesis. But once that line continues lower to around -1 standard
deviation, bad things happen in the market. The ultimate story here is that we
definitely need earnings and revenues to improve dramatically in 2016 to
justify a continued bull market.

Margins
We’ve written in the past about the mean reverting nature of
profit margins and when margins start to deteriorate that isn’t usually a good
sign for the market.

In a recent note to clients, Bank of America analysts (via Business
Insider) recently had this to say about margins during the last earnings
season, “The proportion of companies
beating on EPS (60%) was the highest since 3Q10, while the proportion missing
on sales (59%) was the highest since 3Q12 — with the gap between the two
surprise ratios the widest since 1Q09. Only Health Care and Tech saw both top
and bottom line beats. While companies have been nimble about managing earnings
to expectations, demand continues to weigh on sales.
In other words,
analysts have found themselves being too bullish on sales but too bearish on
earnings per share. Maybe they're just bad analysts. Regardless, it does not
hide the fact that demand is disappointing. And without demand, those profits
are not sustainable.”

The folks over at FactSet
have put into perspective the deterioration we’ve seen in the corporate
earnings outlook. They write, “As of
today [January 15, 2016], the
blended earnings decline
for the fourth quarter
for the S&P 500 stands
at -5.7%. Factoring in the average improvement in earnings growth during
a typical earnings season due to upside earnings surprises, it still appears
likely the S&P 500 will report a year-over-year decline in earnings for the
fourth quarter. If the index does report a year-over-year decline in earnings
for the fourth quarter, it will mark the first time the index has reported
three consecutive quarters of year-over-year declines in earnings since Q1 2009
through Q3 2009.”
“This past week marked
a change in the aggregate expectations of analysts from slight growth in
year-over-year earnings (0.1%) for Q1 2016 to a slight decline in
year-over-year earnings for Q1 2016 (-0.6%). However, expectations for earnings
growth for Q1 2016 have been falling not just over the past few weeks, but over
the past few months as well. On September 30, the estimated earnings growth
rate for Q1 2016 was 4.9%. By December 31, the estimated growth rate had
declined to 0.9%. Today, it stands at -0.6%”.
Their views on revenue projections are equally morose. “The blended revenue decline for Q4 2015 is
-3.3%. If this is the final revenue decline for the quarter, it will mark the
first time the index has seen four consecutive quarters of year-over-year
revenue declines since Q4 2008 through Q3 2009.”
So it appears that we will see revenues for the S&P 500
decline in 2015 year by roughly 2.5% while earnings will growth approximately
1%. Analysts are expecting revenues to grow 3.8% this year and 5.5% in 2017
while earnings are expected to increase 6.8% and 12.6% year-over year in 2016
and 2017, respectively.


To meet these projections we will have to start breaking all
kinds of records as it relates to margin expansion. That is difficult enough to
do when revenues are growing at a reasonable pace but in a world of slowing
global economic growth and rising interest rates and a buoyant US dollar it’s a
puissant task to say the least. Perhaps corporate America will wring additional
cost savings and productivity from the middle of the income statement or more
likely continue on its financial engineering escapade that started a few years
ago. Whatever the case we are highly suspect that further margin expansion can
be obtained.

Earnings Quality
Speaking of financial shenanigans, the folks over at
Deutsche Bank (via Business
Insider) pointed out the following graphic.

They state, “Another
trend worth watching: since late last year, pro forma S&P 500 EPS has
exceeded reported (GAAP) EPS by more than 30%, well above the ~10% gap for most
of 2013 and 2014 and the widest gap since the Financial Crisis. In 3Q15, nearly
60% of the difference between GAAP and adjusted EPS was attributable to Energy,
Metals & Mining and Machinery, where asset impairments/write-downs were the
biggest contributors. Another ~20% of the difference was related to Health Care
(chiefly Pharma, Biotech and Health Care Equip/Supplies), largely due to
acquisition-related costs/impairments.
A couple of analysts
have flagged this latter item, which is tricky to justify. On one extreme, you
have folks who would argue that all the adjustments being made to earnings are
justified. On another extreme, you have folks who would argue that these
accounting shenanigans are tantamount to fraud, if not outright fraud.
Analysts refer to all
of this in the context of earnings quality. If companies are able to deliver
earnings without having to make a ton of accounting adjustment, then earnings
quality is arguably high.
"Be mindful of
the gap between GAAP and non-GAAP EPS," Deutsche Bank's David Bianco wrote
earlier this month. "We have always argued that the best EPS measure lies
somewhere between GAAP and non-GAAP EPS."
Bianco thinks this gap
between GAAP and non-GAAP earnings will narrow in 2016.
Ultimately, sales are
weak, and earnings quality is low. And all of this eventually has to correct.
How this affects investors' attitudes toward these stocks will bear watching.”
We like to view earnings with an eye out for accrual vs.
cash component. If two companies have the same EPS but company A has a higher
portion of its earnings that are cash then it is believed that company A has
higher earnings quality. The greater the cash component to earnings the less
trickery on the income statement for the purposes of artificially boosting
earnings per share is what we’ve come to embrace.

When we aggregate
this for the S&P 500 we are looking at how much of the reported earnings
per share are supported by increases in cash flow from operations and investing
activity. We can then scale this by a balance sheet item for cross reference;
we tend to use total assets.
The next chart plots the earnings quality for the S&P
500. A rising figure indicates improving EQ while a falling figure shows
deterioration. We have seen this figure peak in 2009 and has been falling
since. While it does appear to have leveled out a bit recently this is a very
volatile time series and can move quickly. It’s worth watching. The cycle highs
and lows corresponded tightly with the highs and lows of the previous two bear
markets and subsequent recoveries.

The Consumer
One note that we read from FactSet stated that negative
preannouncements within the Consumer Discretionary sector was running well
above record. According to FactSet,
“At the sector level, the Consumer
Discretionary and Information Technology sectors have the highest number of
companies issuing negative EPS guidance for the fourth quarter. This is not
surprising, as these two sectors
have historically had
the highest number of
companies providing quarterly
EPS guidance on average.
What is surprising,
however, is the unusually high number of companies in the Consumer Discretionary
sector issuing negative EPS guidance for Q4. While the number of companies
issuing negative EPS guidance in the Information Technology sector (22) is
slightly below the 5-year average (23.5) for the sector, the number of
companies issuing negative EPS guidance in the Consumer Discretionary sector
(25) is well above the 5-year average for the sector (15.9).”
Considering the US consumer is said to be the driving force
of the US economy and the fact that Consumer Discretionary stocks have been the
strongest stocks in the major indices makes this trend worth following.
According to work done by Keith McCullough found on the Hedgeye
blog, “"The US stock market has
never NOT crashed (i.e. a 20% or more decline from peak – that would get you
1704 SPX from the 2130 #bubble high) when corporate profits go negative for 2
consecutive quarters," Hedgeye CEO Keith McCullough wrote earlier today in
a note to clients.”

Bottom Line: Personally
speaking I’ve been wrong and humbled by the market more times than Charlie
Brown trying to kick Lucy’s snap. I’ve come to respect any tidbit of
information the market chooses to pass along. We view our trading and investing
thesis with an eye towards the consequences of our actions. Returns are
important but risk measures are equally if not greater in importance. We don’t
want to come across as a permabear but we want to analyze all that can go
wrong. We’re not saying a recession is imminent but are saying that economic
and market based projections are late to spot trouble. The market appears to be
telling us perhaps something not yet ascertained in the barrage of economic
figures thrown our way. Hope for the best but plan for the worst.
Joseph S. Kalinowski, CFA
Email: joe@squaredconcept.com
Twitter: @jskalinowski
Facebook: https://www.facebook.com/JoeKalinowskiCFA/
Blog: http://squaredconcept.blogspot.com/
Additional Reading
Is
this another 2008 for the stock market? – CNN Money
20% More
Downside Coming in the S&P500 – All Star Charts
Weekly
Stock Market Outlook: Bulls Go Into Hiding – See It Market
3
Charts Every Investor Must See – The Felder Report
Technically
Speaking: Managing A Trend Change – Real Investment Advice
Key
Market Breadth Indicator Hits New Lows: An Ominous Sign? – See It Market
No part of
this report may be reproduced in any manner without the expressed written
permission of Squared Concept Partners, LLC.
Any information presented in this report is for informational purposes
only. All opinions expressed in this
report are subject to change without notice.
Squared Concept Partners, LLC is an independent asset management and
consulting company. These entities may have had in the past or may have in the
present or future long or short positions, or own options on the companies
discussed. In some cases, these
positions may have been established prior to the writing of the particular
report.
The above
information should not be construed as a solicitation to buy or sell the
securities discussed herein. The
publisher of this report cannot verify the accuracy of this information. The owners of Squared Concept Partners, LLC
and its affiliated companies may also be conducting trades based on the firm’s
research ideas. They also may hold
positions contrary to the ideas presented in the research as market conditions
may warrant.
This analysis
should not be considered investment advice and may not be suitable for the
readers’ portfolio. This analysis has been written without consideration to the
readers’ risk and return profile nor has the readers’ liquidity needs, time
horizon, tax circumstances or unique preferences been taken into account. Any
purchase or sale activity in any securities or other instrument should be based
upon the readers’ own analysis and conclusions. Past performance is not
indicative of future results.