It’s been quite a week for investors as sentiment has
decidedly turned negative. The trick is not to panic. Two weeks ago we decided
to add portfolio protection in our program portfolios. We wrote in our blog on
August 9th entitled Time to Consider Portfolio Protection, “Market fundamentals are signaling
over-valuation and market sentiment/momentum appears to be weakening. This
along with less accommodative monetary policy on the horizon increases the risk
of a market correction, in our view. We will maintain our existing portfolio
but will start introducing “portfolio insurance” in the coming weeks and months
as the market dictates. It is impossible to predict market tops and bottoms but
it is prudent to alter the risk profile of the portfolio with changes in market
data. We’d rather risk a portion of future upside if we are wrong in our
analysis than risk previous gains if we’re right.”
We are fortunate to not have suffered major losses in our
program portfolios and our more opportunistic portfolio is decidedly positive
month-to-date. Given the recent action, it’s now time to review our positions
and continue to build upon our investment thesis.
Short-term Action
We are expecting the market to stage some sort of rebound
from its current level. In the figure below, we are seeing what I would
describe as fairly rare opportunities. On Friday, the spot and future prices
for the VIX inverted and that ratio shot above one. This usually signifies a
near-term market bottom. The Put – Call ratio spiked to 1.69. Anything above
1.4 also indicates near-term overreaction and a possible bounce in the market.
Lastly, the VIX itself rallied over 100% in the past five trading days. When
looking at the second derivative rate of change for the VIX, anytime there is a
big upward spike in such a time frame, it usually indicates a near-term buying
opportunity. In fact, going back to 1990 there have only been 31 cases in which
the VIX spiked over 50% in five trading days. In 27 of those cases (87% of the
time) the market traded higher over the next five trading days with an average
gain of 3%.

Staying with the S&P 500 as a benchmark, both the RSI
(5) and fast stochastics are signaling extreme oversold conditions. We would
expect the market to rally to the top of the shaded range in the following
figure or roughly 2020. Depending on the strength of the rebound we may see the
market advance further to 2040 which appears to be the base of the neckline
that started earlier this year. Beyond that the next resistance level may be
the 200-day moving average of 2077 but I’m doubtful that level will be reached
given the severity, volume and technical damage of this sell-off. We will see
how trading next week starts and if we see stabilization and upward action on
the daily MACD histogram, we will take profits on the equity put options that
we introduced to the portfolio. For our more opportunistic clients, we will be
looking to trade the bounce.
Intermediate – Term
Action
That said, weekly and monthly momentum is decidedly negative
for the SPX and portfolio insurance is a fact of life for the foreseeable
future. We believe the stock market will continue lower after the short-term
bounce described earlier. We will be looking for a few things. We would want to
see (1) the RSI (5) and fast stochastics reach overbought levels, (2) one of
the three test points mentioned earlier provide verifiable resistance and (3)
daily MACD histogram resume lower. If those events were to happen, we will
reposition ourselves with the appropriate downside protection and look for
additional market weakness.
We have written in the past that fundamentally it appears
the market is overvalued and is due for a correction. (See The
Coming Market Correction?) We did not know what the catalyst would be to
start the correction as investor sentiment remained bullish. We commented that
a possible cause of the coming correction may be unsettling headlines out of
China. It appears that may be happening. An article in CNN Money entitled - China's
economy is in trouble. How bad is it? ; states two sides of an argument.
They write, “There is almost no way that
China's economy is growing as well as the government says it is. For years,
experts have questioned whether China cooks its books. "The question is
not whether they're right, it's how wrong are they," says Derek Scissors,
an Asia expert at the American Enterprise Institute. But you don't need a PhD in statistics to
figure it out this time. Just take a look at what China's government has been
doing lately: making a surprise devaluation of the yuan in an effort to boost
exports, propping up its markets by actually buying stocks, spending big and
cutting interest rates in an effort to stimulate its economy. China wouldn't be taking these actions if
the country really was chugging along at the 7% growth rate that the latest
government data claims. "China could be in the world's greatest
depression and they would still report 7%," says Gordon Chang, a China
expert and author of “The Coming Collapse of China." (Emphasis added)
They go on to compare two popular arguments on the Chinese
economy:
“Here's the case for a
2% vs. 5% growth scenario:
1. It's a major
slowdown. Chang says he has heard that in Beijing, they are privately talking
about 2% growth. He's not surprised. Across the board, the statistics don't
look good with everything from steel to rail freight to electricity consumption
showing big drops. China's manufacturing sector looks especially weak --
sentiment just hit its lowest level in six years.
"There's a lot
there that looks really wrong," says Chang.
While Chang
acknowledges that China is taking various stimulus measures, he is concerned
that a lot of the growth is coming from people, companies, real estate
developers and even local governments taking on more debt. "The growth
they are creating is crap growth," says Chang. "They're aggravating
their debt problem and they have no solution." He estimates the true GDP
number is likely 1% to 2% growth. Expect China to hurt American company
earnings for the rest of the year. Even worse, expect more panic "because
people think that China is more important than it actually is."”
Or…
“2. It's a minor
hiccup. Other experts say that predictions of a "hard landing" in
China go too far.
"This is not
2009," says Scissors, the America Enterprise Institute scholar. He
estimates GDP is growing at about 4.5%. Global forecasting company Capital
Economics has traded jabs with the Chinese government before over the validity
of the government statistics. Capital Economics believes China is likely
growing at 5% to 6%. China's economy probably did a lot worse than what it
reported in the first half of the year, but there could be a pickup in the
second half, especially as all of the stimulus measures take root. "There
are signs the economic conditions are improving," says Mark Williams,
chief Asia economist at Capital Economics. He reminds people that growing at 5%
to 6% isn't the "very dark place" some are warning about. Another key
for Americans to remember is that when the Chinese get nervous, they tend to
invest their money abroad. "Bad Chinese economy performance means more
Chinese money leaving their country, and the No. 1 place it comes is
here," says Scissors.”
What stands out to me is that the argument has shifted from
a “grow vs. slow” debate to “slow vs. even slower” one. A slowing Chinese
economy certainly has profound implications on our economy and equity markets
but it’s yet too soon to know if this will result in a U.S. market correction
or the groundwork for the next “big – one” bear market.
This turmoil is definitely reflected in asset prices in Asia.
According to Arthur Hill at StockCharts.com,
“SHANGHAI COMPOSITE BREAKS LONG-TERM
MOVING AVERAGE... Chart 11 shows the Shanghai Composite ($SSEC) moving below
its 50-day moving average, stalling and then breaking its 200-day moving
average. A triangle formed to mark the consolidation over the last two months
and this is a consolidation within a downtrend, which is typically a bearish
continuation pattern. With a close at 3507 on Friday, the index broke the
200-day and triangle support to signal a continuation lower. Chart 12 shows the
X-Trackers China A-Shares ETF (ASHR) breaking support in late June, bouncing
back to 44 and breaking down again this week.”


For the purposes of our intermediate investment strategy we
will assume recent market action as the start of a potential market correction
(down 10% from its peak) vs. a bear market (down 20%). A keen eye on portfolio
protection and defending previous gains is warranted as we wait and see if
investor sentiment has truly taken a turn for the worse.
Speaking of Investor
Sentiment
In an interview with CNBC,
Robert Shiller stated the following on the contagious effects of negative
investor sentiment. They write,”Nobel
Prize-winning economist Robert Shiller has warned for months against being
overexposed in an overheated market. And with the major U.S. averages pacing to
cap their worst week of the year Friday, it certainly appears to be a
well-timed caution, but Shiller isn't saying it's over yet. "It could be
followed by even bigger and bigger moves," he told CNBC's "Squawk on
the Street" in an interview. "I have a general bias towards down
because the market is overpriced, but these things unfold over years."
While Shiller conceded the possibility that the selloff could "create
aftershocks in either direction in the short-term," he highlighted a
psychological bias for those in the periphery to "over focus on the latest
news." "When people who don't normally pay attention to the market
are brought in, it can feed on itself like an epidemic," he said.”
The Case for a
Correction
Negative headlines out of China and the potential of
investor pessimism spreading has us looking at fundamental valuation once
again. Several weeks ago we wrote, “Based
on Bloomberg data, the companies that comprise of the S&P 500 are expected
to show $125.71 in earnings per share over the coming twelve months and have a
current earnings yield of 6.1%. Book value per share for the index is $736.68
with a BV yield of 35.4% and cash flow per share of $180.23 for a CF yield of
8.8%. If we weight each valuation measure according to accuracy in predicting
future price movements our blended fair value for the S&P 500 is $1702 or
about 18% overvalued.”
We are of the opinion that the combination of negative news,
deteriorating investor sentiment and an overvalued market could be the genesis
of a +10% correction for the S&P 500. Other valuation measures outside of
our own paint a similar picture.
Henry Blodget, of Business Insider
writes this, “In the past year or two,
stocks have moved from being "expensive" to being "very
expensive." In fact, according to several historically valid measures,
stocks are now more expensive than they have been at any time in the past 130
years, with the exception of 1929 and 2000 (and we know what happened in those
years). The chart below is from Yale professor Robert Shiller. It shows the
cyclically adjusted price-earnings ratio of the S&P 500 for the past 130
years. As you can see, today's PE ratio of at least 26 is miles above the long-term
average of 15. In fact, it is higher than at any point in the 20th century,
with the exception of the months that preceded the two biggest stock-market
crashes.”

“What about other
valuation measures? Most of them paint the same picture. Here, for example, are
a few recent charts from Doug Short, one of the best market-chart makers
around. The first chart plots four valuation measures — the Shiller P/E ratio
above, another P/E ratio (different calculation), the "Q ratio" (a
measure of price to replacement cost), and a regression analysis for stocks
themselves. Same message: Averaging the four suggests that stocks are ~80%
overvalued.”
“And for good measure,
here's another ratio — one that is fondly referred to as "Warren Buffett's
favorite valuation measure." (Because he once said it was.) This one
charts the collective value of all stocks to the size of the economy (GDP). It
recently hit its second-highest level ever.”
More Evidence of
Intermediate Market Weakness – Credit Spreads
As this article in Fox
Business reports, “With the S&P
500 and the Dow Jones Industrials tossing away their gains for the year, bond
prices are rising in what could be a bad omen for U.S. stocks. Investors poured
$1.3 billion into U.S. Treasuries for the week ended August 19, the biggest
score since mid-April, according to data from Thomson Reuters’ Lipper. The
yield on the 10-year benchmark, which trades inverse to bond prices, is
hovering at 2.084% and has been on the decline since early July; and that trend
may continue according to Mary Ann Bartels, chief investment officer of
portfolio solutions at Bank of America Merrill Lynch Wealth Management (BAC).
“The 10-year yield is starting to break down, technically pointing to lower
lows, it could break 2% technically,” said Bartels on FOX Business Network’s
Mornings with Maria.”
“As bond yields fall
and bond prices rise, U.S. stocks are paying the price. As of Thursday, the
S&P 500 is down 1% for the year, the Dow Jones Industrials nearly 5% while
the Nasdaq Composite hangs onto its 3% gain. A big reason investors are
gravitating toward the safety of U.S. government debt is China. “Large
institutions are selling due to China.” said Jason Rotman, managing partner of
Lido Isle Advisors, while appearing on FOX Business Network’s Risk &
Reward.”
The standing divergence between credit spreads and stock
prices has been pointed out previously in this blog as the bond market has
been predicting a market correction from earlier this year. It is only now that
the stock market seems to be listening to the warnings from the bond market.
Negative Intermediate
– Term Momentum
The following graphic shows that long – term momentum has
turned negative, solidifying our belief that the stock market will continue its
downward move after the coming “bounce”. After a slight upward movement in the
SPX to the 2020 - 2070 level the market should offer additional shorting – portfolio protection
opportunities probably through September and October, in our opinion.
Is this the Big One?
The question will arise as to the magnitude of the
continuation of the sell-off. We do believe a market correction (down +10% from
the peak) is in order. We are not thinking a full blown bear market (down +20%
from the peak) is in the cards. Of course this is nearly impossible to predict
but our opinion is that all the intermediate problems mentioned above (negative
news out of China, overvaluation concerns and deteriorating momentum) will wash
out and the bull market will continue higher. We are anticipating a correction
within the bull market currently.
We just don’t see the signals that we are accustomed to
prior to a major downward movement in the stock market.
As Scott Grannis of Calafia
Beach Pundit points out, “For the
past several months, TIPS have been telling us that inflation expectations have
been declining—though only moderately: deflation is still nowhere to be found.
At the same time, the rise in real yields on TIPS tells us that the market is
expecting somewhat stronger growth—though still far less than enough to erase
the economy's huge output gap, which I estimate to be about $1 trillion per
year. It's a message that should do nothing to derail the Fed's plan to
normalize interest rates at a somewhat higher level, and it should do nothing
to provoke an outright tightening of policy. Slow and relatively stable growth,
accompanied by relatively low inflation, is not very exciting, but it's not
something to worry about either. It's supportive of continued, modest gains in
equity prices.”

“In the chart above,
the difference between the nominal yield on 5-yr Treasuries and the real yield
on 5-yr TIPS gives us an expected annual (CPI) inflation rate of 1.27% over the
next 5 years. This is relatively low compared to past history for this series,
but it is nowhere near the levels that reflect deflation risk, such as we saw
at the end of 2008.”
“As the chart above
shows, the recent decline in this same expected inflation rate over the next 5
years is driven by and large by the price of oil. Lower expected inflation is
not a symptom of tight money; it is the by-product of strong gains in oil
production. As such, this is a welcome development, since a lower cost of
energy enables a stronger economy.”
“As the chart above
suggests, the real yield on 5-yr TIPS tends to track the economy's growth rate.
Which makes sense, since the real growth of the economy sets an upper limit on
the real growth of its constituent parts. If the bond market is comfortable
with risk-free real yields of 0.3% for the next 5 years, then real growth in
the broad economy is quite likely to be somewhat higher. This year's increase
in real yields suggests that the market is pricing in a modest acceleration in
the rate of GDP growth over the next year or so. Nothing to get excited about,
but nothing to worry about either.”
I like to track trucking and rail shipments as a gauge of
economic activity. As we mentioned in our posting
on July 12, we are still seeing year-over-year growth in rail traffic, although
the numbers we track are provided quarterly so we will need to update this when
the September figures are released. Truck tonnage continues to show gains as
well. Back to the post by Scott Grannis, “The
physical weight of stuff carried by the nation's trucks increased 3.7% in the
year ending July. This is a pretty good indication that the economy is growing.
As the chart [below] shows, truck tonnage correlates reasonably well with the
real value of U.S. equities. As the economy expands, real stock prices
increase, which makes sense. The modest increase in truck tonnage in the past
years suggests that the stock market is not in a bubble (neither undervalued
nor overvalued), and is likely to increase modestly for the foreseeable future.”

The Atlanta Fed publishes its GDPNow
indicator that attempts to forecast quarterly economic growth. They have been
very accurate of late and it is something I have started watching on a
continuing basis. They write, “The GDPNow
model forecast for real GDP growth (seasonally adjusted annual rate) in the
third quarter of 2015 is 1.3 percent on August 18, up from 0.7 percent on
August 13. The forecast for real GDP growth increased from 0.7 percent to 1.2
percent after Friday's industrial production release from the Federal Reserve.
Most of this increase was due to a 15.3 percent increase in seasonally adjusted
motor vehicle assemblies in July that boosted the forecast of the contribution
of real inventory investment to third-quarter GDP growth from -2.2 percentage points
to -1.8 percentage points.”

The housing market remains firm as well. According to Tom Lee of Fundstrat (via Business
Insider): “The US housing market
recovery is the most important reason to still believe in the bull market,
according to Fundstrat's Tom Lee.”
“In a note to clients
on Friday, Lee wrote (emphasis and link added): "In our view, the most important element for remaining constructive is
the ecosystem benefiting from a US housing recovery. July
2015 housing starts rose to 1.206mm, reaching a 7-year high and further
confirmation of a broadening housing recovery which should lead to US housing
starts rising to 1.7-2.0mm (typical peaks) ... US residential construction is
3.3% of GDP but is expected to rise to at least 5.5% (1.7mm starts) and such an
increase would more than offset the 40% decline in Energy capex, which has
fallen from 1% of GDP to 0.6%. In fact, as we show, starts need to reach
1.374mm to fully offset the 40% decline in Energy spending, which could be seen
within 12 months." Lee says that although the past few weeks have been the
worst of 2015 for the stock market, his call for a longer-term rally, and the
2,325 year-end target on the S&P 500, is unchanged.”
Manufacturing continues to chug along despite weakening
figures of late. According to Markit
Economics, “U.S. manufacturers
indicated a renewed loss of momentum during August, with output, new business
and payroll numbers all increasing at a slower rate than in the previous month.
As a result, the headline seasonally adjusted Markit Flash U.S. Manufacturing
Purchasing Managers’ Index™ (PMI™)1 dipped from 53.8 in July to 52.9 in August.
The index remained above the neutral 50.0 threshold, but the latest reading was
the lowest since October 2013.”
The way I track manufacturing data is to combine all the
surveys into one z-score that is easy to read and quick to reference. The
aggregate manufacturing score combines ISM Manufacturing PMI, the Philly Fed outlook,
the Dallas Fed manufacturing survey, the Chicago Fed activity index, the Empire
State manufacturing survey, the Richmond Fed manufacturing survey and the
Cincinnati PMI. I think that just about covers this country’s manufacturing
sector. Outside of a strange divergence between the manufacturing figures and
the S&P 500 that started earlier this year (possibly correcting itself
currently) it appears the manufacturing sector continues to chug along as we
have seen for many quarters with no significant breakdowns showing. Of course
the market is the leading indicator in this case but further significant
weakness in this model would change our investment thesis as it relates to a
coming bear market.

Indeed many other economic metrics that we track are showing
slow but positive year-over-year growth. Further deterioration in these
economic models may sway our longer-term investment thesis but for now we are
going to assume the economy is not heading for a recession.
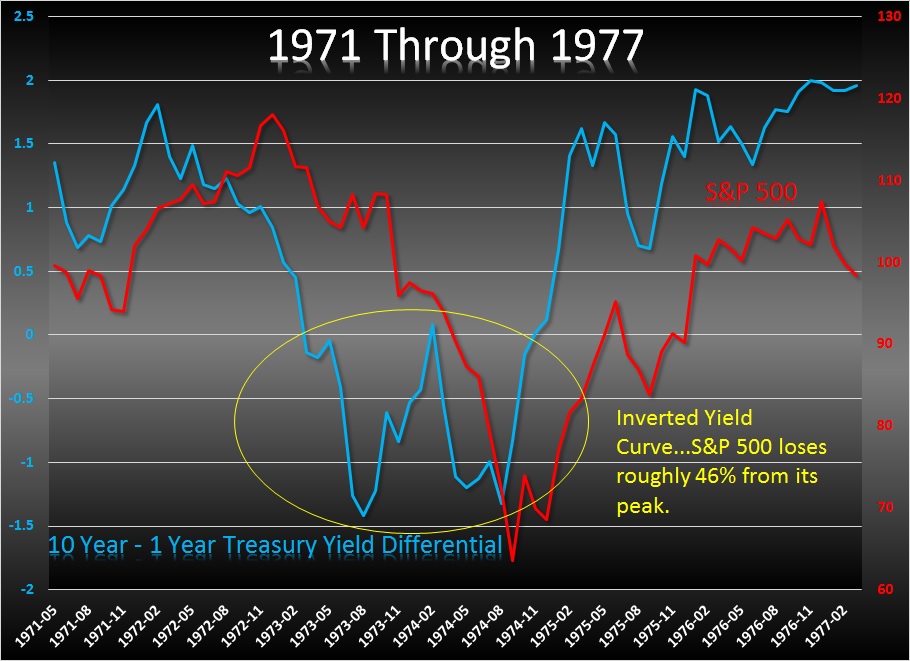
Monetary Policy
We understand the Fed’s desire to normalize monetary policy
and ween the market off of its multi-year ZIRP program. We watch the yield curve
(the spread between the two and ten year treasury yield) as our best gauge of
economic strength. An inverted yield curve is a dangerous sign for the stock
market and we were not all that concerned about the current positioning until recently. The flight
to quality is now driving the ten year yields lower just as the Fed anticipates
raising rates on the short end. If the model below gets to an inverted position
then we would definitely need to rethink our investment thesis but for the most
part it currently is not flashing a long-term economic warning.

Given the recent market weakness, many are speculating that
a Fed rate hike in September is off the table. From Business
Insider, “On Wednesday, we got the
much-anticipated minutes from the Federal Open Market Committee's July meeting.
However, they did little to support anybody's conviction about a September rate
hike. The minutes indicated that although the Fed saw the economy approaching
the conditions appropriate for a rate hike, members thought those criteria had
not yet been reached. From the minutes:
... The Committee
agreed to continue to monitor inflation developments closely, with almost all
members indicating that they would need to see more evidence that economic
growth was sufficiently strong and labor markets conditions had firmed enough
for them to feel reasonably confident that inflation would return to the
Committee's longer-run objective over the medium term.
The Committee
concluded that, although it had seen further progress, the economic conditions
warranting an increase in the target range for the federal funds rate had not
yet been met. Members generally agreed that additional information on the
outlook would be necessary before deciding to implement an increase in the
target range ...
And so, it seemed that
the Fed simply confirmed what everyone knew — that the economy was accelerating
— but not quite as fast as necessary to raise rates. At the end of the day,
markets were left "slightly lost, upset, and confused," as Deutsche
Bank's Jim Reid put it in a note to clients on Thursday. And this was enough to
squash expectations for September. The probability of a rate increase next
month plunged from 50% to 36% in a single afternoon on Wednesday.
And then, stocks
entered a correction
In two days, US stocks
tumbled far enough to log the worst week since September 2011. After falling to
a six-month low on Thursday, the Dow on Friday lost more than 500 points and
entered into a correction — defined as a 10% drop from recent highs. The
S&P 500 closed down 5% for the week and lost more than 100 points in a week
for the first time since 2008. On Friday afternoon, the probability for a rate
hike next month was lower still, at 34%.”
Corporate Earnings
True revenues and earnings are slowing somewhat but we do
not anticipate a severe earnings drought in the near-term. In our July
12th comments we wrote, “…it’s
also beneficial to look at the quality of earnings that are produced within the
S&P 500. I like to track the index net operating income less its cash flow
from operating and investing activities. One can then scale it by total index
assets for easier cross index comparisons but for simplicity the chart below is
shown as a z-score or where it lies on the bell curve. Knowing how much of
reported earnings is supported by cash received versus accrued is key when
using financial ratios and attaching a multiple to determine fair value.
When the earnings
quality line is falling, then earnings quality is deteriorating. When it’s
rising then it an earnings quality improvement. Notice both the market tops in
1999 - 2000 and 2007 – 2008 correlated with a -4 reading in the EQ chart. While
earnings quality currently is deteriorating, it is nowhere near the dangerous levels
of the previous two bear markets. For all the talk about sinister financial
engineering used to goose profits, it appears to me that there is still some
wiggle room to continue down this road for a while longer.”

Bottom Line: In the
near-term we are expecting the market to bounce from current depressed levels.
We will use this opportunity to book profits from our protective positions and
trade the bounce for our more opportunistic clients. Once the bounce has
happened we will reinstate the portfolio protection as we believe the market
will remain weak in the intermediate-term with a possible correction looming
(+10% from the peak). This could last through October. For the long-term we
believe this is a correction in a bull market and the economy and the market
will resume its uptrend. We will make portfolio adjustments as the data
dictates.
Joseph S. Kalinowski, CFA
Additional Reading
No part of
this report may be reproduced in any manner without the expressed written
permission of Squared Concept Partners, LLC.
Any information presented in this report is for informational purposes
only. All opinions expressed in this
report are subject to change without notice.
Squared Concept Partners, LLC is an independent asset management and
consulting company. These entities may have had in the past or may have in the
present or future long or short positions, or own options on the companies
discussed. In some cases, these positions
may have been established prior to the writing of the particular report.
The above
information should not be construed as a solicitation to buy or sell the
securities discussed herein. The
publisher of this report cannot verify the accuracy of this information. The owners of Squared Concept Partners, LLC
and its affiliated companies may also be conducting trades based on the firm’s
research ideas. They also may hold positions
contrary to the ideas presented in the research as market conditions may warrant.
This analysis
should not be considered investment advice and may not be suitable for the
readers’ portfolio. This analysis has been written without consideration to the
readers’ risk and return profile nor has the readers’ liquidity needs, time
horizon, tax circumstances or unique preferences been taken into account. Any
purchase or sale activity in any securities or other instrument should be based
upon the readers’ own analysis and conclusions. Past performance is not
indicative of future results.