Saturday, September 24, 2016

Pair's Trading Update


As we had mentioned in our last pair’s trading update, we had miscalculated on the appropriate weighting and suffered unwanted volatility in the portfolio when the market initially sold off on September 9th (Making Adjustments To Our Pair's Trading Model). Since making the adjustments we have seen an improvement in both portfolio volatility and returns.

Roughly two-thirds of our pair’s trades are profitable (15 out of 24) with an average holding period of 17 days. The average return per trade is -0.02% but this is largely due to a few trades that we didn’t weight appropriately. While many of the misallocated pairs have been closed, there are a handful that we are still working. Our total portfolio is down 2.9% over the past month. Since we reconfigured the model, we are profitable 7 out of our last 7 trades.


We are pleased to see the z-score relative price performance model starting to bear fruit.


Long XHS / Short SPY


Long XLP / Short SPY


Long VOO / Short XLK


Long XLV / Short SPY


Long XLU / Short SPY


Long VOO / Short XLF


Long XLY / Short XLF


Long XLY / Short XLK


Long XLY / Short SPY


Long XLB / Short XLF


Long XLV / Short XLK


Joseph S. Kalinowski, CFA


No part of this report may be reproduced in any manner without the expressed written permission of Squared Concept Asset Management, LLC.  Any information presented in this report is for informational purposes only.  All opinions expressed in this report are subject to change without notice.  Squared Concept Asset Management, LLC is a Registered Investment Advisory and consulting company. These entities may have had in the past or may have in the present or future long or short positions, or own options on the companies discussed.  In some cases, these positions may have been established prior to the writing of the particular report. 

The above information should not be construed as a solicitation to buy or sell the securities discussed herein.  The publisher of this report cannot verify the accuracy of this information.  The owners of Squared Concept Asset Management, LLC and its affiliated companies may also be conducting trades based on the firm’s research ideas.  They also may hold positions contrary to the ideas presented in the research as market conditions may warrant.

This analysis should not be considered investment advice and may not be suitable for the readers’ portfolio. This analysis has been written without consideration to the readers’ risk and return profile nor has the readers’ liquidity needs, time horizon, tax circumstances or unique preferences been taken into account. Any purchase or sale activity in any securities or other instrument should be based upon the readers’ own analysis and conclusions. Past performance is not indicative of future results.


Saturday, September 17, 2016

Three Things This Week - Remaining On The Sidelines


Volatility is back. In our core Fishbone model we remain in cash and are waiting for a clearer picture from the market before wading back in. On the daily S&P 500 chart the key levels of support are 2120, 2100, 2015 and 2000. The 2120 level has held thus far which was prior resistance. The 2100 level is the bottom of the trend line from the February lows. The 2050 to 2060 level is both the 200 day moving average and the 38.2% Fibonacci retracement from the February lows and 2000 is both a psychological figure and the 50% Fibonacci retracement from the February lows.


Ideally we want to see the S&P 500 retake the 20 and 50 day moving averages and have MACD momentum improve before taking aggressive long positions.

The daily Nasdaq shows waning momentum on all the oscillators as well as MACD. It’s settling in near the 5190 level that was previous resistance and is holding the 20 and 50 day moving averages. A breakdown could send the index to the 5000 level. The next stop below that is around 4900 which is the 200 day moving average and the 38.2% Fibonacci retracement from February. Unlike the S&P 500, the Nasdaq isn’t sitting below its moving average trend lines but ideally we would like to see momentum improve.


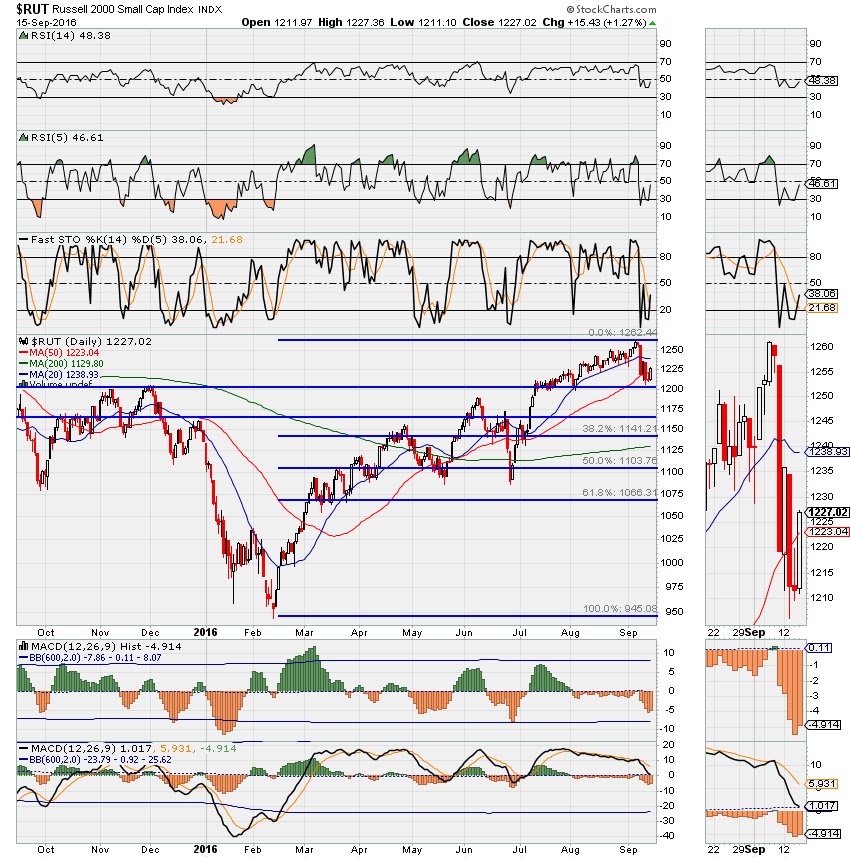
The Russell 2000 bounced off the 1200 support level and has retaken the 50 day moving average.


Should the market start to rebound strongly from here, we believe the small cap sector could be a relative outperformer. During the recent bout of volatility, it appears the small caps have suffered the worst relative to the S&P 500 and Nasdaq. Looking at the relative performance of these indices it appears the small caps are sitting on major support levels relative to the others.


On The Sidelines

Aside from watching the technical picture, we’re waiting for several key events in September to happen before we move back into equities. Key central bank meetings from the Fed and BOJ as well as the first presidential debate.

The Fed

Regarding the Fed, we’re looking at a fairly low probability of a September rate hike, near 20%. An increase in rates by the Fed in September would act as a shock to the market and could send the market lower – or at the very least increase volatility in a very dramatic way. Considering we are right in front of the elections we do not expect the Fed to raise in September. The Fed also sees the probabilities and one would imagine they too wouldn’t want to introduce excessive market volatility at this juncture.


That said they could leave rates unchanged but change to a more hawkish message to lay the ground work for a rate hike in December. This is probably a more likely outcome and can have negative effects on equity prices as well but to a lesser degree.

The markets had recently priced in higher rates. Looking at utilities vs. financials is a great way to catch a glimpse of how the market views the interest rate environment. The following chart looks at the relative pricing comparison between utilities (XLU) and financials (XLF). We had a breakout earlier this year and have held support a few times. We have recently reached that support level and are now bouncing off. Ultimately even with a 25bp increase in the fed funds we believe utilities will remain attractive for income seeking investors and margins at financial companies will see a slight improvement. We don’t anticipate the relative outperformance of utilities (up 17% this year) to financials (up 3% this year) to end just yet.


Long-term treasuries (TLT) have also trended higher this year relative to financials. The price comparison between the two recently tested the up channel support and will likely hold as the trend of excessively low interest rates isn’t ending anytime soon, in our opinion. The economy just doesn’t seem like it’s there yet (see Our Thoughts On The Economy).


The Election

The market frowns on uncertainty and there is little doubt that Trump is gaining ground on Clinton in the polls. According to real clear politics Trump is now only 1.1 points behind Clinton nationally, and gaining ground.


While Trump has a long way to election, a path is starting to materialize. The chart below shows the current electoral map giving Clinton the edge.


Within the battleground states, Trump is polling ahead of Clinton in Ohio, Florida, Iowa, Arizona and Georgia. He is virtually tied in Nevada and North Carolina. If we give Trump all these states and the remaining to Clinton she will win the presidency.

That said, if we keep our electoral map assumptions constant but Trump pulls an upset in any of the states that are circled in Red. Trump wins!

The current campaign strategy that Trump is utilizing is working. Tone down the rhetoric and stick to the issues. The Clinton campaign is up against major difficulties at this point. They have to (1) promote the existing policies that are largely unpopular with a large portion of the country; (2) continually try to deflect and defend past misdeeds and health issues which is difficult to do with a daily drip of perceived indiscretions by Clinton and; (3) continually attack Trump which is becoming an annoyance for those that are interested in the issues and haven’t yet made up their mind to vote.

This has the makings of an upset and we believe the first debate this month will set that tone and could conceivably decide the race. If Trump comes out on top it could initiate a more aggressive equity sell-off in the near-term.

As mentioned the market does not like uncertainty. Perhaps the new Trump will surprise the market with a more focused and pinpointed way to get his message across but historically he has said things that could have caused an equity sell-off if he were a serious contender. If the situation arises and he is the front-runner the market will start paying attention to his words much more than they have in the past, in our opinion.

What was said in the past that could damage investor sentiment:

Trump: Americans should avoid stock market - Donald Trump suggested Tuesday that Americans should not place their retirement funds into the stock market, warning of “some very scary scenarios.”” – The Hill 8/2/16.


A closer look at Donald Trump's comments about refinancing U.S. debt - During a pair of recent interviews, presumptive Republican nominee Donald Trump made waves by suggesting that he might try to refinance the U.S. federal debt.” – Politifact 5/16/16.

There are those that share the unease of having a leader that talks first and thinks later.

Wall Street is unprepared for a Trump victory - Should Trump continue to rebound in the polls, watch for market volatility to increase as investors brace for uncertainty. Citigroup recommends increasing exposure to precious metals like gold as an offset. Yet any associated selloff could prove a buying opportunity.” – Business Insider 9/2/16.

Opinion: Politics is the bull market’s biggest hurdle - David Woo, head of global interest rate and foreign exchange strategy for Bank of America Merrill Lynch, said Wall Street is pricing in a big Clinton victory, but investors could start selling if she lags in the polls. He argues investors prefer the likely gridlock, slow growth and easy monetary policy a Clinton presidency would offer to a potential bull-in-the-china-shop Trump administration. As the old saying goes, the devil you know. ...” – Market Watch 9/9/16.

If Trump wins, stocks will crash 50%: Wedbush pro - All in all, Winer {Ian Winer, Wedbush's director of equity sales trading} believes Trump's policies would lead to a nation on weaker fiscal footing, with a lack of cheap labor and a lack of cheap goods. In this environment, the multiple paid on S&P 500 earnings would dramatically decrease, he said.

"If all the policies are enacted," the S&P's price-to-earnings ratio "could go as low as 11," which is how you "get to 1,000 on the S&P," Winer wrote. That would represent a 50 percent drop from current levels.” – CNBC 3/16/16.

Clinton Health Another Land Mine for Suddenly Vulnerable Markets – “If Clinton’s health becomes a larger factor with regard to voter decision-making, the market may have to recalculate the risk-reward of a regime change in the White House, as Clinton right now is assumed as a continuity from the current administration,” Yousef Abbasi, global market strategist at JonesTrading Institutional Services LLC, said by phone. “Obviously today is another thing that’s going to draw closer attention.” – Bloomberg 9/11/16.

Bank of Japan

The last event of September that we will be watching closely are the monetary policy decisions that will come out of Japan. With $13 trillion of global debt sitting at yields below 0% the folks at the BOJ are seeking new and innovative ways to keep their economy chugging along. It would seem that they are talking about instituting their own version of “operation twist” and are exploring the idea of manipulating the steepness of the yield curve on their sovereign debt. The idea is that artificially low rates and a flat yield curve has pinched banking institutions, pensions, savers, insurance companies, etc. - basically any corporation or person that relied on an income and/or yield spread strategy to profit are suffering. Their argument as I understand it is that the flatness of the yield curve is hindering economic growth.

There are two problems we see here. The first is that the steepness of the yield curve should be a market driven function that reflects market participants’ views towards future economic growth expectations. Attempting to manipulate rates over the long term is futile and we don’t understand the consequences of such actions yet, in our view. With all the experimental monetary policy happening in the global economy today, the truth is that we haven’t really seen the return to a robust global economy.

That said, because of the low/zero interest rate policies that have been in place for so long and the relative flatness of the yield curve, many of these banking institutions, pensioners, savers, insurance companies, etc. have spent years making adjustments to minimize the profit impact of these policies. Thus they may have a greater than wanted exposure to longer term instruments, exposure to increased leverage and concentrated portfolios. If the BOJ were to deliberately attempt to steeped the long yield, these types of investment structures would suffer dramatically as the duration on their portfolios may be higher than desired and more sensitive to adverse pricing pressure.

This type of market event could exacerbate a sell-off in the fixed income market that could very well spill over to equities.   

Bottom Line: We continue to sit on the sidelines as this coming week contains a few pitfalls that could have an effect on the US equity markets. If market volatility continues then we will remain in cash in our core Fishbone portfolio and will continue to wait for an appropriate entry point. If we sail through the remainder of the month and the market regains its footing, then we will redeploy and take advantage of the upside.

Key Dates

September 21 – Both the Fed and BOJ meet to determine the future direction of monetary policy.

September 26 – The first presidential debate.


Joseph S. Kalinowski, CFA

Email: joe@squaredconcept.net

Twitter: @jskalinowski

Facebook: https://www.facebook.com/JoeKalinowskiCFA/

Blog: http://squaredconcept.blogspot.com/

Web Site: http://www.squaredconcept.net/


Additional Reading


No part of this report may be reproduced in any manner without the expressed written permission of Squared Concept Asset Management, LLC.  Any information presented in this report is for informational purposes only.  All opinions expressed in this report are subject to change without notice.  Squared Concept Asset Management, LLC is a Registered Investment Advisory and consulting company. These entities may have had in the past or may have in the present or future long or short positions, or own options on the companies discussed.  In some cases, these positions may have been established prior to the writing of the particular report. 

The above information should not be construed as a solicitation to buy or sell the securities discussed herein.  The publisher of this report cannot verify the accuracy of this information.  The owners of Squared Concept Asset Management, LLC and its affiliated companies may also be conducting trades based on the firm’s research ideas.  They also may hold positions contrary to the ideas presented in the research as market conditions may warrant.

This analysis should not be considered investment advice and may not be suitable for the readers’ portfolio. This analysis has been written without consideration to the readers’ risk and return profile nor has the readers’ liquidity needs, time horizon, tax circumstances or unique preferences been taken into account. Any purchase or sale activity in any securities or other instrument should be based upon the readers’ own analysis and conclusions. Past performance is not indicative of future results.


Sunday, September 11, 2016

Making Adjustments To Our Pair's Trading Model


We had started a new pair’s trading model several weeks ago and started to build positions. The market had been very quiet with little volatility so we were waiting for a day like Friday to stress-test several components of the model. Given the rather robust equity sell-off it allowed us to monitor the positions and get acquainted with the various nuances that appear in any new investment model.

We suffered losses in the portfolio but we also found the weak points in our execution. The good news is that ten of the fifteen pair’s trades that we initiated were net gainers on the day, meaning the long positions did not fall as much as the short positions. That success rate of 67% in a market that was down almost 3% on the day is encouraging.

What did not work in our favor was the method of allocation we placed on each side of the trade, i.e. we were exposed too aggressively to the downside due to our error in weighting the positions.

We went to work this weekend to figure out what needed improvement and to put new procedures in place to assure this flaw in the system was eliminated.

Where We Miscalculated

Going into these trades we were basing our net long/short exposure on weightings derived from the last six months’ beta between the two securities in question. We understand now that recent pricing sensitivity has very little correlation to future pricing sensitivity and the method of beta calculation that we were using was skewed too far in one direction to be effective. The chart below shows one example of a pair’s trade that we initiated last week, long PFF / short SPY.


The red triangle represents the short term average (six month) beta profile that we used for this specific trade. The blue square is the long-term average (since 2007) beta profile and the green circle is the long-term median point within the range of beta between the two instruments.

Using the red triangle as our beta profile we saw on Friday that PFF was down 1.2% on the day. The SPY was down 2.4% on the day. That left us with a net loss on the pair’s trade of approximately -0.6%. Had we used the longer term average beta profile our net loss on the trade would have been -0.2% on the trade. Had we used the median figure our net gain on the trade would have been +0.5%.

Our relative performance z-score lets us know when there is an obscure pricing opportunity, i.e. pricing that resides near those protruding arrows in the figure above.  We trade on the assumption that those points on the outer boundaries will make their way back to the center and profit from the spread. By taking such an aggressive long/short ratio as we did in our current trade we have minimized our profit scenario to PFF rising much faster than SPY or falling much less than SPY as opposed to a reasonable mean reversion of the two prices. The basis of our relative price performance z-score is much more effective using the median beta weighting.

That happened across the board on Friday. Our long VOO / short XLK resulted in a net pair’s loss of -0.3% when technology clearly underperformed the S&P 500. Using the median approach would have resulted in a gain of +0.2% on the trade for the day. The long PCY / short SPY trade resulted in a net loss of -0.4% vs. +0.6% using the median method. The long EMB / short SPY resulted in a net loss of -0.5% vs. what could’ve been a net gain of +0.6%. Short XLI / long VOO resulted in a smaller net loss of -0.1% vs. a potential gain of +0.3%. We were down a net -0.9% in short XLE vs. long VOO but could’ve net a gain of +0.4%.

The list goes on as most of our pair’s moved in the right direction for us even though we lost money on most of them.

Corrective Action

We are of the opinion that the recent market weakness seen Friday has the potential to continue over the next several weeks and months. This is a call that we have been making for the last few weeks. We took profits from the Brexit lows in our core portfolio over the last two weeks and attempted to set up defensive positions as pair’s trades to mitigate suspected market weakness.

Given our belief of further weakness we are taking the following corrective actions in our pair’s portfolio.

(1)    We will rebalance our existing pair’s trades to better reflect the median beta profile we discussed. We anticipate this could help us recoup a majority of Friday’s losses and at the very least decrease the volatility that we experienced last week.

(2)    All pair’s trades going forward will be done using the new trade balancing methodology as discussed.

(3)    Over the next few weeks and months, as our macro market outlook improves and we start to build positions in our core portfolio we will use that as an opportunity to peel off the newly inserted shorts used to rebalance the portfolio. This will allow us to recapture the cost of our market lesson on Friday.

(4)    Stay vigilant and alert to additional nuances within our pair’s strategy.


Joseph S. Kalinowski, CFA

Email: joe@squaredconcept.net

Twitter: @jskalinowski

Facebook: https://www.facebook.com/JoeKalinowskiCFA/

Blog: http://squaredconcept.blogspot.com/

Web Site: http://www.squaredconcept.net/


No part of this report may be reproduced in any manner without the expressed written permission of Squared Concept Asset Management, LLC.  Any information presented in this report is for informational purposes only.  All opinions expressed in this report are subject to change without notice.  Squared Concept Asset Management, LLC is a Registered Investment Advisory and consulting company. These entities may have had in the past or may have in the present or future long or short positions, or own options on the companies discussed.  In some cases, these positions may have been established prior to the writing of the particular report. 

The above information should not be construed as a solicitation to buy or sell the securities discussed herein.  The publisher of this report cannot verify the accuracy of this information.  The owners of Squared Concept Asset Management, LLC and its affiliated companies may also be conducting trades based on the firm’s research ideas.  They also may hold positions contrary to the ideas presented in the research as market conditions may warrant.

This analysis should not be considered investment advice and may not be suitable for the readers’ portfolio. This analysis has been written without consideration to the readers’ risk and return profile nor has the readers’ liquidity needs, time horizon, tax circumstances or unique preferences been taken into account. Any purchase or sale activity in any securities or other instrument should be based upon the readers’ own analysis and conclusions. Past performance is not indicative of future results.


Wednesday, September 7, 2016

New Pair's Initiated


New Pairs Trades

For more information on our pair’s trading methodology please click here.
Long Silver (SLV) / Short Gold (GLD)


Long Utilities (XLU) / Short S&P 500 (SPY)


Long iShares JPMorgan USD Emerging Markets Bond (EMB) / Short S&P 500 (SPY)


Long iShares US Home Construction (ITB) / Short S&P 500 (SPY)


Long PowerShares Emerging Markets Sov Dbt ETF (PCY) / Short S&P 500 (SPY)


Long iShares US Preferred Stock (PFF) / Short S&P 500 (SPY)


Portfolio Update


Long Consumer Staples (XLP) / Short S&P 500 (SPY)

This trade has really moved against us today. We believe it still rests on support and short-term momentum is still positive. We still believe the “defense trade” will work over the next several weeks and months.


Long Health Care (XLV) / Short S&P 500 (SPY)

Admittedly we should have waited for a MACD bullish cross before going into this trade. We broke a rule and it hurt us. That said the Health Care sell-off is overdone and we hold a small position in the pair. We will be watching for an improvement in momentum and build on this position.


Portfolio Metrics

Joseph S. Kalinowski, CFA


No part of this report may be reproduced in any manner without the expressed written permission of Squared Concept Asset Management, LLC.  Any information presented in this report is for informational purposes only.  All opinions expressed in this report are subject to change without notice.  Squared Concept Asset Management, LLC is a Registered Investment Advisory and consulting company. These entities may have had in the past or may have in the present or future long or short positions, or own options on the companies discussed.  In some cases, these positions may have been established prior to the writing of the particular report. 

The above information should not be construed as a solicitation to buy or sell the securities discussed herein.  The publisher of this report cannot verify the accuracy of this information.  The owners of Squared Concept Asset Management, LLC and its affiliated companies may also be conducting trades based on the firm’s research ideas.  They also may hold positions contrary to the ideas presented in the research as market conditions may warrant.

This analysis should not be considered investment advice and may not be suitable for the readers’ portfolio. This analysis has been written without consideration to the readers’ risk and return profile nor has the readers’ liquidity needs, time horizon, tax circumstances or unique preferences been taken into account. Any purchase or sale activity in any securities or other instrument should be based upon the readers’ own analysis and conclusions. Past performance is not indicative of future results.