
The market’s obsession with the inner workings of central
bank policy continues. The latest figures place the probability of a rate hike
at the end of this month at 0%. The probability is less than 30% for a hike in
June and July. It’s only until we reach the end of the year (December 2016) and
the start of next year (January 2017) that the probability of a hike exceeds
50%.

The Fed’s dual mandate of steady employment and prices
remain but has recently become a bit muddy as Chair Yellen has been basing
monetary policy decisions on unorthodox objectives. Year-over-year nonfarm
payrolls have been growing slightly above average over the past several years.

Inflation expectations have been quite low but have risen
recently. US Core PCE (seasonally adjusted) has started trending higher and
inflation expectation as measured by the risk premium between 10 year TIPS and
10 year government yields confirms the move. In fact, inflation expectations are
coming off the lowest levels since 2010.


The question remains what is keeping the Fed so dovish and
when will they have the confidence to start to take a more aggressive stance
towards tightening.
While the employment picture seems to be in-line with what
the Fed hopes to achieve and most likely price stabilization is running
slightly below target levels, the US and world economies continue to struggle
and perhaps the Fed lacks conviction of the US economy to withstand additional
tightening. While true the global stock markets have recovered from the furious
bout of volatility from earlier in the year, oil prices have staged a recovery
and China concerns have once again subsided, we are not out of the weeds just
yet. The International Monetary Fund just downgraded global economic growth
again citing concerns about strife in the Middle East, European refugee
concerns, the possibility of a British departure from the EU and anti-trade
sentiment that has stemmed from our political process. The rapid rise of the
Japanese Yen (we were bullish on the Yen in our March 7th blog
note) has splashed cold water on the Japanese economy in spite of moving to
negative interest rates.
First quarter economic growth for the US according to GDPNow,
the Atlanta Fed forecasting model that has been spot on recently shows the US
economy growing an anemic 0.3% in 1Q16. This is compared to just less than 1.5%
growth based on economist forecasts.

Indeed the economic analysis coming from the XE
Blog (they do a great job at tracking all things economic) states, “This week’s two primary releases were
coincident economic indicators that showed a slowing consumer and industrial
sector. Neither development is
encouraging as we begin the second quarter and both are likely culprits for the
Atlanta Fed’s GDPNow model’s decline to a .3% 1Q16 growth rate…With the LEIs
barely rising and much slower rate of growth for the CEIs, it’s doubtful we’ll
see stronger much growth in 2Q.”
Additional pressure on the global economic front comes from
the non-oil export figures out of Singapore. This country is considered to be a
good barometer for global growth as it has multiple trading partners in the Pacific
Rim. This morning Business
Insider reported, “As a global
barometer for the health of the global economy, Singapore continues to paint a
bleak picture at present.
Not only did its
economy fail to grow in the first three months of the year, demand for the
nation’s exports is now also plummeting.
According to
International Enterprise (IE), non-oil exports (NODX) from the country fell by
15.6% in the 12 months to March, missing already dire forecasts for a
contraction of 13.2%.
The annual contraction
was the steepest recorded since February 2013 and well below the 2.0% annual
gain previously recorded in February.”

“Although the data is
volatile, exports have now contracted on an annualised basis in three of the
past four months. As a major global trade hub, the continued weakness in
exports suggests global demand remains weak, underscoring concerns from the IMF
and others that global economic growth may once again undershoot expectations
in 2016.”
The economic picture in our view doesn’t warrant new highs
in the stock market and yet the market continues to climb. This leads us to
believe that the market is moving higher on the tenets of additional monetary
stimulus (or a departure from a tightening stance for the Fed) and a bout of
short covering. Take that with drastically reduced corporate earnings and
revenues and we have potential problems on the horizon. Not the greatest recipe
for a sustained market rally.
Other concerns that may hinder the Fed from further
tightening was brought to light from Deutsche Bank's chief US economist, Joe
LaVorgna (via Business
Insider). To summarize his points, here are the meeting dates and
additional reasons the Fed may stay its hand.
4/27/16 meeting – No rate increase due to slowing 1Q16
economic growth.
6/15/16 meeting – No rate increase due to sub-par 2Q16
economic growth and the volatility arising from the Brexit situation (that
meeting happens on June 23).
7/27/16 meeting – No rate hike because it coincides with the
Democratic National Convention (July 25-28) and is only a few days after the
Republican National Convention (July 18-21).
9/21/16 meeting – No hike due to the proximity of the US
general Presidential election.
11/2/16 meeting - No hike due to the proximity of the US
general Presidential election.
12/14/16 meeting – This would be the earliest the Fed could
hike if it were at all concerned about the above factors. It appears based on
the Fed implied probabilities that the market is expecting something similar to
the above scenario pending some obscure bout of growth or inflation.
Surprise Fed Action
If we toss fundamentals aside temporarily and assume the
market will be dictated by monetary policy, at least temporarily then a
surprisingly hawkish Fed statement or unanticipated move in rates could have
some fairly dire consequences. We believe the market has currently prices in an
increasingly dovish Fed which is expected given the state of the global
economic environment.
Investment Grade Bonds
On the daily chart, investment grade bonds have seen a
fairly parabolic move this year as the Fed softened its stance. The chart for
LQD (IG bond ETF) has had a strong move to the upside but we are starting to
see some negative bearish divergences between prices and the oscillators and
MACD. A hawkish Fed tone can bring this ETF lower. The LQD weekly chart looks
equally extended and is probably due for a pullback or at the very least a
consolidation period. The LQD monthly chart also shows several bearish
divergences as new highs in the index are met by lower highs in the technical
readings. Fed action counter to market expectations could mean trouble for the
sector.


High Yield Bonds
We are seeing bearish divergences all over the high yield
bond market. We are tracking this sector using the iShares High Yield ETF
(HYG). This sector has also seen big moves from its lows earlier in the year
and surprising central bank action will take its toll here as well. We are
concerned about these bearish divergences because high yield prices move very
closely with US stocks. The five year correlation coefficient between HYG and
SPX (S&P 500) is greater than 90%. More recently in the past twelve months
that relationship has come down to roughly 76% as prices between high yield
bonds and stock prices have diverged. We pointed out in previous writings that when
these divergences have occurred (stocks outperforming high yield bonds) it has
usually coincided with stock market corrections and in extreme cases bear
markets.
On a weekly basis, the high yield ETF is largely overbought
but remains in its downward channel. The recent parabolic rally came on lower
volume.


US Equities
On the daily chart the S&P 500 remains in its downward
channel despite the recent rally. The sugar rush from last week’s announcement of
an oil production freeze will be short lived in our opinion and isn’t a strong
enough catalysts to change our view. Economic growth and corporate earnings don’t
support current valuation levels in our view. The best chance we have of
continuing the rally to new highs will be excessively dovish Fed action. We are
seeing some potentially bearish divergences on the chart. Given the technical
picture as well as the earnings and economic fundamentals, we are still
expecting a rather rough and volatile summer market.
The weekly SPX chart shows an over-extended market that
still resides in a downward channel. The monthly chart has improved a bit but
far from ideal. Similar to the start of the last two bear markets, RSI (14) has
dipped below 50 but this time around it has retaken that level. That is a good sign. There has been
a MACD bearish cross, but that negative momentum has subsided somewhat. Prices
broke the 20-month moving average to the downside and the slope of the 20MMA
turned negative. We have recently retaken the 20-month average and it is
sloping higher again. If these metrics start to fail once again and the US
economic and corporate earnings picture doesn’t improve, we could see the
S&P 500 fall all the way to 1600 (which is the 38.2% Fibonacci level off
the 2009 bottom. Perhaps another round of QE or negative interest rate policy
by the Fed would save the day to avoid these levels


US Dollar
The US dollar has priced in the new dovish Fed. It has been
in a clear down channel recently but downside momentum has been waning. We
think it could drop back to the 93.5 level based on the daily chart. If this
level holds as support again it could offer another trading opportunity. On the
weekly chart the US dollar is oversold and approaching a key support level at around
93.5. If this level holds again it would offer a trading opportunity and if the
Fed makes an unexpected hawkish move, we could see the US dollar break the 100
level to the upside. The monthly chart shows positive momentum for the dollar
and would act as support for the coming trade near 93.5.


Japanese Yen
Clearly the rise in the Yen has frustrated Japanese policy
makers. Excessive quantitative easing and zero interest rate policies haven’t
stopped the Yen advance. This would most likely increase the chances of
additional Bank of Japan intervention although feedback from the recent G20
meeting indicates a lack of cooperation from other central banks and policy
makers. From Business
Insider, “Japan's efforts to seek
informal consent to act against an unwelcome yen rise bore little fruit, with
the United States offering a cool response to concerns voiced by Tokyo that the
currency's gains are too sharp and may justify intervention.
A lack of G20 sympathy
for Tokyo's appeal may embolden yen bulls to test the currency's 17-month highs
against the dollar hit earlier this month, keeping Japanese policymakers on
edge to contain the damage on a fragile, export-reliant economy… In a communique
issued on Friday, the G20 finance leaders maintained a warning on countries to
refrain from competitive currency devaluation and signaled that markets have
calmed from the past few months of turbulence.
The G20 also
reiterated that excess currency volatility was undesirable, but only after
heavy lobbying by Japanese delegates who want to use the language to justify
stepping into the market if they see yen gains as excessive.
Tokyo won't be
engaging in competitive currency devaluation as long as any yen-selling
intervention is brief and aimed at smoothing abrupt yen rises, a senior
Japanese finance ministry official told reporters after the G20 gatherings.”
They go on to cite, “the
government may lean on the Bank of Japan to deploy another blow of monetary
stimulus as early as its next rate review on April 27-28.
BOJ Governor Haruhiko
Kuroda waded into the currency debate to describe past yen rises as
"excessive," and reiterated his pledge to take additional monetary
easing steps if yen moves hurt the economy.
While many BOJ officials
are wary of acting again so soon after having deployed negative interest rates
in January, Kuroda may be ready to pull the trigger, some analysts say.
U.S. economist Nouriel
Roubini, who claims to have spoken to Japanese central bankers, signaled on
Friday the BOJ may be nervous enough about the yen's rise to ease even before
the April meeting.”
On the daily Yen chart, we are seeing some possible bearish
divergences off its most recent rally and a near-term pullback could be in
order. Momentum has been very strong on the weekly chart but we are approaching
levels that would coincide with government intervention, at least temporarily.
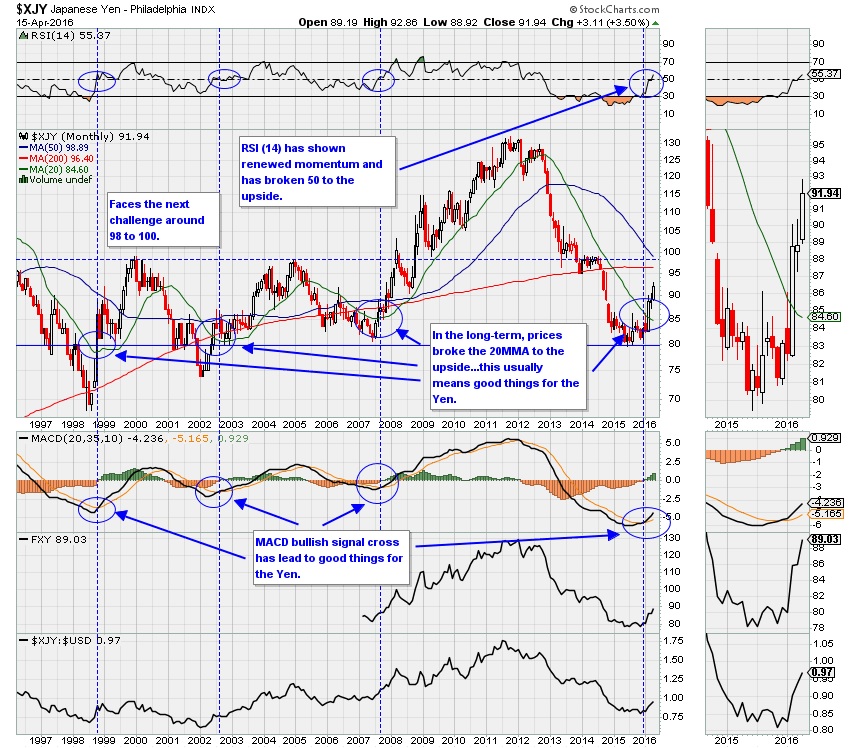
On the monthly chart we are seeing many bullish signs. RSI (14) has risen back
above 50 coincided with a bullish MACD cross. In previous instances this has occurred
prior to major upward moves in the currency and usually during periods of US
stock market turmoil. A long position in the Yen could provide cover if we get
a major stock market sell-off this summer. We could see a short-term pullback
but longer-term optimism.
The oil production freeze negotiations out of Doha this
weekend have broken down driving oil prices lower and providing a boost for the
Yen. From Bloomberg,
“The lack of agreement at Doha highlights
the deep divisions between OPEC members, and importantly, within Saudi Arabia,
said Robert Rennie, the global head of currency and commodity strategy at
Westpac Banking Corp. in Sydney. The Aussie should hold support from about
75.75 cents to 76 cents at least through the next day or so, he said.
The yen appreciated
0.3 percent to 108.41 per dollar. Earlier it touched 107.77, approaching the
107.63 level reached on April 11, the strongest since October 2014.”


The Yen remains a crowded long as reported by Bloomberg.
“Hedge funds and other large speculators
have never been more bullish on the yen.
Positions that benefit
from gains by Japan’s currency exceeded those that benefit from losses by a net
66,190 contracts in the week ended April 12, a report from the Commodity
Futures Trading Commission showed Friday. That’s the most in data going back to
1992.”

Gold
In the latest Commitment of Traders report for gold, we are
seeing a fairly crowded long speculative trade while commercial contracts show
the users of gold are locking in prices at current levels, an indication that
gold could head lower. From Seeking
Alpha, “In the latest Commitment of
Traders report (COT), we saw a week where speculative gold longs increased their
positions while speculative gold shorts slightly decreased their positions.
Speculative gold longs stand at over 200,000 contracts, which is the highest
since August of 2011 - when the gold price achieved its all-time high.
Additionally, commercial gold traders (bullion banks, producers, retailers,
etc.) increased their short position to the highest since February of 2013.”
“This week's report
shows a large increase in speculative longs with speculative shorts slightly
decreasing their positions.”

“As is clear in the
table above, speculative positioning significantly favors the long side as
speculative longs now hold 214,349 contracts versus the speculative shorts at
30,131 contracts.
This is the highest
nominal speculative long position since August of 2011!”

“The yellow line in
the table above is the all-time COT report high for the gold price at $1,895
per ounce. The big difference, though, is that currently we have around 30,000
speculative traders short gold, while in 2011, that was fewer than 5,000
contracts short - so even though we've hit nominal speculative long highs, the
percentage of shorts is still much higher now and that means there could be
room to grow.
Finally, when we take
a look at commercial traders (bullion banks, miners/producers, large merchants,
etc.), we see that they have significantly increased their short positions.”

“They have essentially
doubled their short positions into this gold rally, and their current short
position of over 194,000 contracts represents the biggest short position these
entities have held since February of 2013. Of course, when it comes to the COT
report there are always two sides to the trade as no short can be established
without a corresponding long and vice versa, but the fact that many of the
traders actually involved in the physical gold world are willing to take the
other side of the gold trade should at least make investors cautious.”
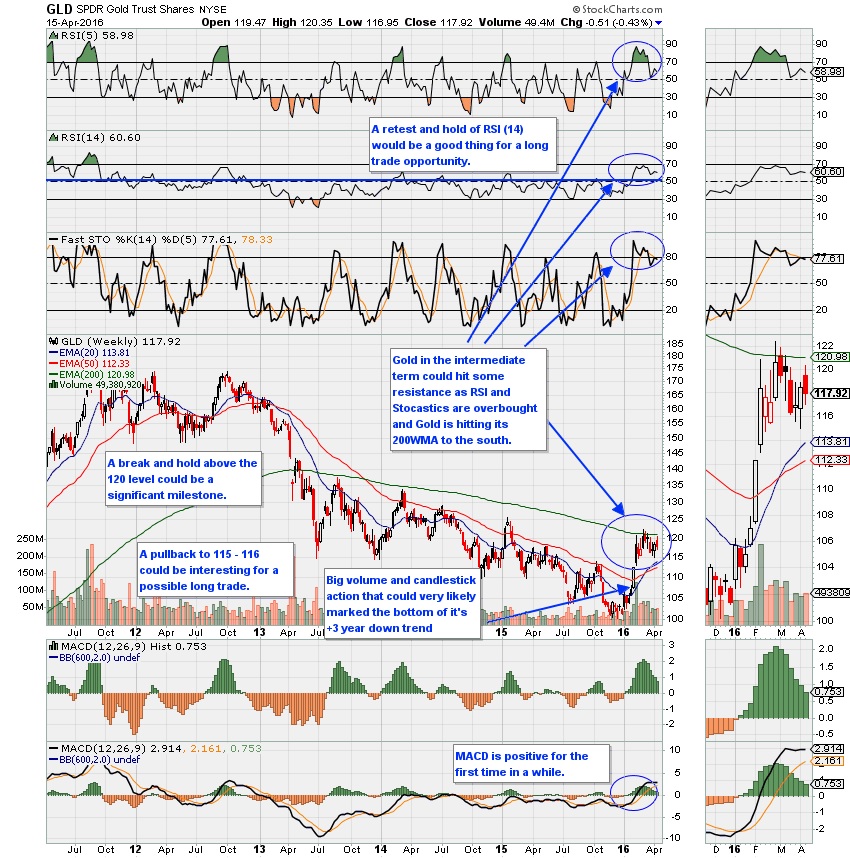
The daily gold chart (GLD) shows the big move for this year
and we appear to be in a consolidation phase. A trade may happen with a
breakout from the downward channel and selling pressure could on a breakdown
could be temporarily exacerbated by the crowded long. Momentum is clearly
improving but we’d be inclined to listen to what the commercial traders are
saying in their trading action.
On the weekly and monthly chart it seems we have snapped a
downtrend that has haunted the metal for some time.


Bottom Line
I’m not one to sell
in May and go away so I want to collect my thoughts on how this summer could
play out. It’s impossible to predict the future of capital market moves but we
are preparing for likely a direction based on specific events.
One key item will be
the Brexit vote in June. A vote in favor of a British exit from the EU could
cause some major summer volatility. If this occurs along with a decelerating
economic picture and a dovish Fed, we’d be inclined to be long gold, Yen and
treasuries and short US dollar, equities and high yield bonds.
If the economic
picture starts to improve heading into the second half of the year, the Fed
takes a more hawkish stance and the Brexit vote results in a no result for
exiting the EU we would take the opposite positions.
Joseph S. Kalinowski, CFA
Email: joe@squaredconcept.com
Twitter: @jskalinowski
Facebook: https://www.facebook.com/JoeKalinowskiCFA/
Blog: http://squaredconcept.blogspot.com/
Additional Reading
Gold
Could Be Heading Beyond $1,400 – Seeking Alpha
No part of
this report may be reproduced in any manner without the expressed written
permission of Squared Concept Partners, LLC.
Any information presented in this report is for informational purposes
only. All opinions expressed in this
report are subject to change without notice.
Squared Concept Partners, LLC is an independent asset management and
consulting company. These entities may have had in the past or may have in the
present or future long or short positions, or own options on the companies discussed. In some cases, these positions may have been
established prior to the writing of the particular report.
The above
information should not be construed as a solicitation to buy or sell the
securities discussed herein. The
publisher of this report cannot verify the accuracy of this information. The owners of Squared Concept Partners, LLC
and its affiliated companies may also be conducting trades based on the firm’s
research ideas. They also may hold
positions contrary to the ideas presented in the research as market conditions
may warrant.
This analysis
should not be considered investment advice and may not be suitable for the
readers’ portfolio. This analysis has been written without consideration to the
readers’ risk and return profile nor has the readers’ liquidity needs, time
horizon, tax circumstances or unique preferences been taken into account. Any
purchase or sale activity in any securities or other instrument should be based
upon the readers’ own analysis and conclusions. Past performance is not
indicative of future results.


