Thursday, October 13, 2016

U.S. Equity Election Risk is Subsiding


We would imagine the best possible outcome of the election as it pertains to U.S. equities is gridlock.

White House: Clinton / Kaine

As of this morning Clinton is leading in the polls of most battleground states. If we award her FL, OH, NC, NV, MN and ME (states where she is marginally leading) she wins. Trump is still slightly ahead in AZ and GA.

If the polls stand where they are we see Clinton with 340 electoral votes vs. 198 for Trump. Clinton will handily get the 270 votes that are needed.


The House: Republicans

While nothing is impossible, the odds of Democrats taking control of the House is a long shot. House Democrats will need to all fifteen toss-up districts. They will also need to win all the districts that are leaning Republican. Additionally, they will need to pick up an additional four districts that are likely Republican to hold the majority. Probably not going to happen.


The Senate: Republicans

Of the eight battle ground states up in the Senate, Democrats need to win five. As of this morning’s polling figures, Democrats are leading by a marginal spread in only two states, WI and IN. Republicans hold slight leads in PA, NV, NC, NH, MO and FL.

Should the polling figures hold, Republicans would retain a 52/48 majority in the Senate.


Bottom Line: We continue to believe the election risks that could potentially depress equity prices has been minimized.

 Joseph S. Kalinowski, CFA


Email: joe@squaredconcept.net

Twitter: @jskalinowski

Facebook: https://www.facebook.com/JoeKalinowskiCFA/

Blog: http://squaredconcept.blogspot.com/

Web Site: http://www.squaredconcept.net/


No part of this report may be reproduced in any manner without the expressed written permission of Squared Concept Asset Management, LLC.  Any information presented in this report is for informational purposes only.  All opinions expressed in this report are subject to change without notice.  Squared Concept Asset Management, LLC is a Registered Investment Advisory and consulting company. These entities may have had in the past or may have in the present or future long or short positions, or own options on the companies discussed.  In some cases, these positions may have been established prior to the writing of the particular report. 

The above information should not be construed as a solicitation to buy or sell the securities discussed herein.  The publisher of this report cannot verify the accuracy of this information.  The owners of Squared Concept Asset Management, LLC and its affiliated companies may also be conducting trades based on the firm’s research ideas.  They also may hold positions contrary to the ideas presented in the research as market conditions may warrant.


This analysis should not be considered investment advice and may not be suitable for the readers’ portfolio. This analysis has been written without consideration to the readers’ risk and return profile nor has the readers’ liquidity needs, time horizon, tax circumstances or unique preferences been taken into account. Any purchase or sale activity in any securities or other instrument should be based upon the readers’ own analysis and conclusions. Past performance is not indicative of future results.


Portfolio Positioning


Weak Chinese export figures are depressing futures this morning. This will be a great test for the U.S. equity markets regarding the resilience and ability to hold the line. Here is our plan of attack for portfolio positioning.

1-      If we sell off aggressively on strong volume and close below the key level of support, then we will introduce hedging instruments in the portfolio to minimize any damage to the downside. The key area of support is 2120 on the SPX. The Nasdaq is sitting on its 50DMA and the Russell 2000 appears to have already broken near-term support.

2-      If we hold the line today, then we will keep our positions in place until the point where we get a large volume rally and breakout at least above 2150 on the SPX. At that point we will increase our long exposure.


Joseph S. Kalinowski, CFA

Email: joe@squaredconcept.net
Twitter: @jskalinowski
Facebook: https://www.facebook.com/JoeKalinowskiCFA/
Blog: http://squaredconcept.blogspot.com/


Web Site: http://www.squaredconcept.net/


No part of this report may be reproduced in any manner without the expressed written permission of Squared Concept Asset Management, LLC.  Any information presented in this report is for informational purposes only.  All opinions expressed in this report are subject to change without notice.  Squared Concept Asset Management, LLC is a Registered Investment Advisory and consulting company. These entities may have had in the past or may have in the present or future long or short positions, or own options on the companies discussed.  In some cases, these positions may have been established prior to the writing of the particular report. 

The above information should not be construed as a solicitation to buy or sell the securities discussed herein.  The publisher of this report cannot verify the accuracy of this information.  The owners of Squared Concept Asset Management, LLC and its affiliated companies may also be conducting trades based on the firm’s research ideas.  They also may hold positions contrary to the ideas presented in the research as market conditions may warrant.

This analysis should not be considered investment advice and may not be suitable for the readers’ portfolio. This analysis has been written without consideration to the readers’ risk and return profile nor has the readers’ liquidity needs, time horizon, tax circumstances or unique preferences been taken into account. Any purchase or sale activity in any securities or other instrument should be based upon the readers’ own analysis and conclusions. Past performance is not indicative of future results.


Monday, October 10, 2016

Consumer Staples Looks Attractive


The market is still trading in a tight range. The past few trading sessions has seen the market sell off initially but recoup most if its losses by the close. It’s a good sign that we are not seeing heavy institutional selling.

On the daily SPX chart, we see a symmetrical triangle has developed signifying listless direction. A big volume break up or down may determine the overall direction of the market through the end of the year.


We are leaning towards a break to the upside for a few reasons.

(1)    Earnings season is beginning and the preliminary movements in earnings estimates have been favorable as we pointed out in our recent blog post Positioning for 4Q16.

(2)    A December rate hike is currently reflected in equity prices.

(3)    The Trump campaign appears to be imploding.

(4)    In most cases a symmetrical triangle breaks in the direction of the overall trend. Since February that trend has been up.

(5)    The Nasdaq and Russell 2000 small caps are performing better than the S&P 500 and are leading the overall market trend higher (meaning they are or are close to holding their 20DMA.)


We have deployed some cash in the portfolio but will get more aggressive should we break to the upside. If we are wrong on our analysis, we will pull positions off and await a better entry.

Consumer Staples

The consumer staples sector has been taking a beating. Over the past ten weeks only utilities have performed worse relative to the S&P 500.


We consider this a buying opportunity and are going to take a position in the consumer staples sector for several reasons.

The fundamental picture has been steadily improving since the end of 1Q16 as seen by the EPS, book value and cash flow trends.


Both earnings and book value per share have a meaningful impact on sector valuation. With twelve month eps forecasts around $27.43 and trailing twelve-month book value per share near $101.66 for the sector, we estimate the sector to be 10% to 15% undervalued.

Our value variance measure that examines the distance between current index prices and perceived fair value is over two standard deviations from the mean. That has represented great entry points for opportunistic trading scenarios in the past.


We also track the rate of change of the value variance to determine the magnitude of the sell-off. This acts as a confirmation of the value variance measure. The chart below highlights the confirmation pattern of the value variance buy signals.


While the fundamental screening process is giving us a buy signal, the technical picture looks a bit rough but one can determine key levels of support that may confirm our investment thesis. On the daily consumer discretionary the index is sitting on the 200DMA that has held as the final front of support on several occasions. We are also seeing a potential bullish divergence between pricing and RSI and MACD. The volume momentum and breadth momentum indicators are also showing waning negative deterioration and a possible bullish divergence.


On the weekly consumer staples chart the uptrend remains in place and the index is sitting near the 50WMA which has acted as support in the past. RSI (14) remains at or near the 50 level and given the improving fundamental picture there isn’t any reason to believe that these previous support levels will fail.


Happy Trading!

Joseph S. Kalinowski, CFA


Email: joe@squaredconcept.net

Twitter: @jskalinowski

Facebook: https://www.facebook.com/JoeKalinowskiCFA/

Blog: http://squaredconcept.blogspot.com/


No part of this report may be reproduced in any manner without the expressed written permission of Squared Concept Asset Management, LLC.  Any information presented in this report is for informational purposes only.  All opinions expressed in this report are subject to change without notice.  Squared Concept Asset Management, LLC is a Registered Investment Advisory and consulting company. These entities may have had in the past or may have in the present or future long or short positions, or own options on the companies discussed.  In some cases, these positions may have been established prior to the writing of the particular report. 

The above information should not be construed as a solicitation to buy or sell the securities discussed herein.  The publisher of this report cannot verify the accuracy of this information.  The owners of Squared Concept Asset Management, LLC and its affiliated companies may also be conducting trades based on the firm’s research ideas.  They also may hold positions contrary to the ideas presented in the research as market conditions may warrant.

This analysis should not be considered investment advice and may not be suitable for the readers’ portfolio. This analysis has been written without consideration to the readers’ risk and return profile nor has the readers’ liquidity needs, time horizon, tax circumstances or unique preferences been taken into account. Any purchase or sale activity in any securities or other instrument should be based upon the readers’ own analysis and conclusions. Past performance is not indicative of future results.


Tuesday, October 4, 2016

Pair's Trades to Initiate


We look to take a pragmatic value approach towards our pair’s trading portfolio. The two sectors that look appealing to us are the packaged food and consumer durables & apparel industries.

Packaged Food

The chart below shows our fair valuation model for the industry. To derive this figure, we compute the earnings, book value and free cash flow yield for the aggregated industry and weight them according to historical pricing correlation. When the trend is higher, then we consider the industry “investable”. Clearly the fair value trend is rising over a longer period of time. There has been a recent dip in the fair value trend that we will watch closely.


We also find that the earnings, book value and free cash flow upward trend remains intact. That is an important consideration.


We find the value variance between the industry price and its fair value expressed as a z-score. Typically, when this model drops below -1.0 standard deviations the industry has offered us excellent trading opportunities.


We also note that the second derivative rate of change often confirms the trading opportunity. Both the value variance and the rate of change figures are signaling a buy for this industry that has an up trending fundamental picture.


On the daily chart the industry has bounced off the 38.2% Fibonacci retracement support from the February lows, it has retaken its 20DMA and both RSI and MACD are showing improving momentum.


On the daily relative rotation graph the packaged food industry has moved from a lagging to an improving industry relative to the SPX.


Taking into account there is no actively traded packaged food industry ETF, we will purchase the individual components in the industry weighted appropriately to mimic the movement of the index.

Long USDJFO / Short XLP

Our relative price performance z-score shows a large divergence between the packaged food industry and the overall consumer staples sector. We will trade this as a pair’s in anticipation of a closing of the gap.


Consumer Durables & Apparel

The fair value and fundamental picture remains in an uptrend.


The value variance model is signaling a buy.


The rate of change is confirming the buy signal.


On the relative rotation graph we are finding the industry is still in the lagging category relative to the SPX but it is moving towards the improving quadrant. We will be monitoring this closely for improvement.


On the daily chart we would like to see the marked support level hold and a bullish MACD cross. We are also seeing a bullish divergence between the index price and the RSI.


On the weekly chart we are sitting at support on the marked ascending wedge. We will keep our stops tight should this pattern fail. Given the fundamental picture, we believe the industry is due for a bounce from these levels. A break through the 320 level could launch this industry much higher.


Taking into account there is no actively traded consumer durables & apparel industry ETF, we will purchase the individual components in the industry weighted appropriately to mimic the movement of the index.

Long GSPLP (S5COND on Bloomberg) / Short XLY

The relative price performance z-score is showing an extreme level of mispricing between the industry and the sector.


Joseph S. Kalinowski, CFA

No part of this report may be reproduced in any manner without the expressed written permission of Squared Concept Asset Management, LLC.  Any information presented in this report is for informational purposes only.  All opinions expressed in this report are subject to change without notice.  Squared Concept Asset Management, LLC is a Registered Investment Advisory and consulting company. These entities may have had in the past or may have in the present or future long or short positions, or own options on the companies discussed.  In some cases, these positions may have been established prior to the writing of the particular report. 
The above information should not be construed as a solicitation to buy or sell the securities discussed herein.  The publisher of this report cannot verify the accuracy of this information.  The owners of Squared Concept Asset Management, LLC and its affiliated companies may also be conducting trades based on the firm’s research ideas.  They also may hold positions contrary to the ideas presented in the research as market conditions may warrant.


This analysis should not be considered investment advice and may not be suitable for the readers’ portfolio. This analysis has been written without consideration to the readers’ risk and return profile nor has the readers’ liquidity needs, time horizon, tax circumstances or unique preferences been taken into account. Any purchase or sale activity in any securities or other instrument should be based upon the readers’ own analysis and conclusions. Past performance is not indicative of future results.


Sunday, October 2, 2016

Positioning for 4Q16


We have started to deploy cash in our core Fishbone portfolio. We understand that October (especially election year October’s) can be quite volatile so we still have cash available in the portfolio and will use a pullback (within market support levels) to build additional positions.

Now that the Fed decision and the first debate is out of the way, we believe there exists several tail winds that could propel the market higher from here.

Politics

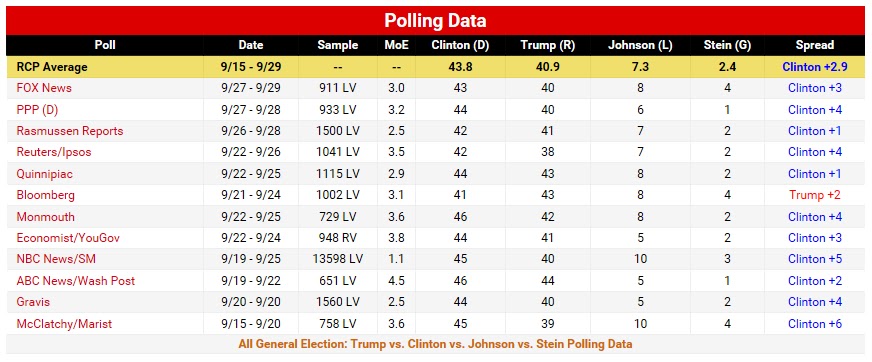
The real clear politics average has Clinton gaining ground in the national polls. While the results are too close to call by any means, it is probably likely that the market is satisfied that Trump’s momentum from a few weeks back has been halted, at least for now.


Clearly the market doesn’t care for the proposition of a Trump presidency. This was seen during and after Trump’s lackluster debate performance when market futures and forex moved in tandem with Clinton’s debate success. According to the NYT, “During the debate, the overnight futures markets rallied, raising the value of broad stock market gauges like the Standard & Poor’s 500-stock index by two-thirds to three-quarters of a percentage point. This was a consequential move, and because it was driven by the reduced chance of a Trump presidency, it reveals that the market believes that stocks would be worth more if he were to lose the election…the rally played out in virtual lock step with Mr. Trump’s debate performance. When Mrs. Clinton pummeled him over his tax returns, stocks rose. And this pattern of stocks rising in response to Mr. Trump’s miscues continued through the evening.”

“Finally, a particularly large rise in the value of the Mexican peso paralleled the rise in S.&P. 500 stock futures. The peso move, which appears to be linked to the reduced likelihood of Mr. Trump’s being able to put into effect his immigration and trade proposals, also suggests that the financial markets’ reaction was a judgment that Mr. Trump lost the debate.”

If we lay out the electoral map and give each candidate the state where he or she is winning (even if it’s by an amount within the margin for error) then Clinton clearly wins the presidency. Political beliefs aside, that would be a good thing for the market in the very short-term.

We know the election is too close to call but we are also assured that Trump will consistently do something dumb to make sure he caps his momentum and doesn’t run away with it prior to election day. That is good for stocks in our opinion.

The Fed & The Economy

The market is placing a 60% chance of a rate hike in December. In our opinion the rate hike is already reflected in prices and we don’t think it will have an overwhelming effect on the market. A 25bp increase with dovish language would most likely rally the market in our opinion. Only a surprise rate increase of more than 25bp may spook equities.


The economy seems to be improving of late but not to the extent that would push the Fed to get more hawkish in their position in our opinion.

The Citigroup Economic Surprise Index has been improving.


Year-over-year industrial production has bottomed and has started to turn higher.


Aggregate manufacturing readings have also started higher signifying a second half rebound for this year.


The Chemical Activity Barometer (CAB) has also turned higher recently. According to the American Chemistry Council, “ACC's Chemical Activity Barometer is a first-of-its-kind, leading economic indicator that helps anticipate peaks and troughs in the overall U.S. economy and highlights potential trends in other industries in the U.S. This barometer can be a critical tool for predicting broader U.S. economic health.”

The Atlanta Fed’s GDPNow economic growth model has been moving lower lately but is still showing 2.4% real GDP (seasonally adjusted annualized) growth for 3Q16. According to the Atlanta Fed GPDNow website, “The GDPNow model forecast for real GDP growth (seasonally adjusted annual rate) in the third quarter of 2016 is 2.4 percent on September 30, down from 2.8 percent on September 28. The forecast of third-quarter real consumer spending growth declined from 3.0 percent to 2.7 percent after this morning's personal income and outlays report from the U.S. Bureau of Economic Analysis (BEA). Following yesterday's GDP revision from the BEA and the Advance Economic Indicators release from the U.S. Census Bureau, the forecast of the contribution of inventory investment to third-quarter growth decreased from 0.60 percentage points to 0.26 percentage points and the forecast of the contribution from net exports increased from -0.13 percentage points to 0.13 percentage points.”

This economic growth isn’t strong enough for the Fed to aggressively start to tighten but it is strong enough to assure the equity markets that we are not headed for recession.

The New York Fed also compiles the data to produce an economic forecast that is the FRBNY Nowcasting Report. They are looking for 2.2% economic growth in 3Q16 and 1.3% for 4Q16. Once again, not strong enough to enter a tightening policy but not too weak to threaten recession.


According to research done on XE Blog by New Deal Democrat, “The recent wobbling continues. While long leading indicators remain almost universally positive, different short leading and coincident indicators have been fluctuating from week to week.  For example, this week oil broke its long positive streak, and temp staffing turned negative, while rail and the Regional Fed indexes improved enough to score neutral.


Among long leading indicators, interest rates for corporate bonds, treasuries, the yield curve, real money supply, real estate loans, mortgage rates, and mortgage applications are positive. A significant negative, however, is that mortgage rates have not made new lows for over 3 years.

 Among short leading indicators, stock prices, jobless claims, gas prices, gas usage, and industrial commodities, are all positive. Oil prices, however, have turned neutral from being positive for over 2 years. Both readings of the US$ are now neutral.  The volatile regional Fed average have improved enough to score as neutral. 

 The coincident indicators remain mixed. Rail has improved enough again this week to score neutral. Consumer spending remains neutral to negative.  The BDI is now positive. Steel, the Harpex shipping index, and bank rates remain negative. Tax withholding is positive. Temp staffing turned from neutral to negative.”

Additionally, there seems to be a dire fear of the markets correcting in any reasonable measure by policy makers across the globe. The markets hit a weak patch largely due to the Deutsche Bank fall-out and suddenly we get leaks of a much more subdued banking fine and news that Chair Yellen would consider buying equities as part of her monetary policy toolbox. The market recovers.

A weak but growing economic picture with policy makers desire to keep the stock market stable ahead of elections will keep the goldilocks stock market scenario in place for a reasonable period of time in our view. That is good for stocks in our opinion.

Corporate Earnings

Earnings season is upon us and we believe it could provide a boost to equity prices. According to FactSet, “The Q3 bottom-up EPS estimate (which is an aggregation of the EPS estimates for all the companies in the index) dropped by 2.9% (to $29.76 from $30.65) during the quarter…Thus, the decline in the bottom-up EPS estimate recorded during the third quarter was smaller than the 1-year, 5-year, and 10-year averages.”

A slowing in earnings deterioration should be considered a good thing for equities.

They go on to note, “After several quarters of year-over-year declines, analysts currently expect revenue growth to return in Q3 2016 and earnings growth to return in Q4 2016. In terms of earnings, the estimated growth rates for Q3 2016 and Q4 2016 are   -2.1% and 5.6%. In terms of revenues, the estimated growth rates for Q3 2016 and Q4 2016 are 2.6% and 5.2%. For all of 2016, analysts are projecting earnings to decline year-over-year (-0.2%), but revenues to increase year-over-year (2.0%).”

It would appear that the profits recession is ending.

We could argue that the market is overvalued based on historical valuation measurements, but only a damn fool would short this market based on historical valuation in light of skewed equity risk premiums exacerbated by aggressive monetary policy easing since the great recession.

The S&P 500 is expected to produce $127.18 in EPS over the coming twelve months. Using Friday’s price of $2168.27 we get an earnings yield of 5.9% compared to 1.59% on the ten-year. Risk premium comparisons between the two are useless at this point. Given historical, five year and ten year average P/E ratios for the S&P 500 one could make the case that the market is 15% to 20% overvalued.

That said, shorter term earnings trends are looking encouraging. The slope of the twelve month forward EPS for the SPX are recovering. The slope of the earnings trend is a key variable to support higher equity prices.


SPX book value and free cash flow have also resumed an uptrend.


The same can be said for the Nasdaq Comp…


…and the Russell 2000


The end of the corporate profits recession and the return of an upward sloping trajectory of fundamentals should provide fuel to advance equities. A strong earnings season approaching can act as a catalyst for this to transpire. That is good for stocks in our opinion.

Technical Picture

The SPX on a daily picture seems to be holding steady. The solid support between 2120 and 2130 held up well last month and the index has regained its 20DMA. It’s now bumping against the 50DMA. A break through that on strong volume will entice us to deploy the remainder of our cash through 4Q16. On the SPX weekly, We’re seeing a pick-up in volume and all the proper support levels are intact. RSI (14) remains above 50 and the rally has been broad based as seen by the action in the equal weighted SPX equivalent. We would like to see a bullish MACD cross sometime soon to confirm the resumption of the uptrend.


On the daily Nasdaq chart all signals are confirming an uptrend. What we don’t like to see is the waning momentum seen in the MACD and the various oscillators. As volume picks up we will be comforted in knowing momentum has returned in a strong fashion. The weekly Nasdaq chart confirms our bullish stance and has yet to show signs of cracking.


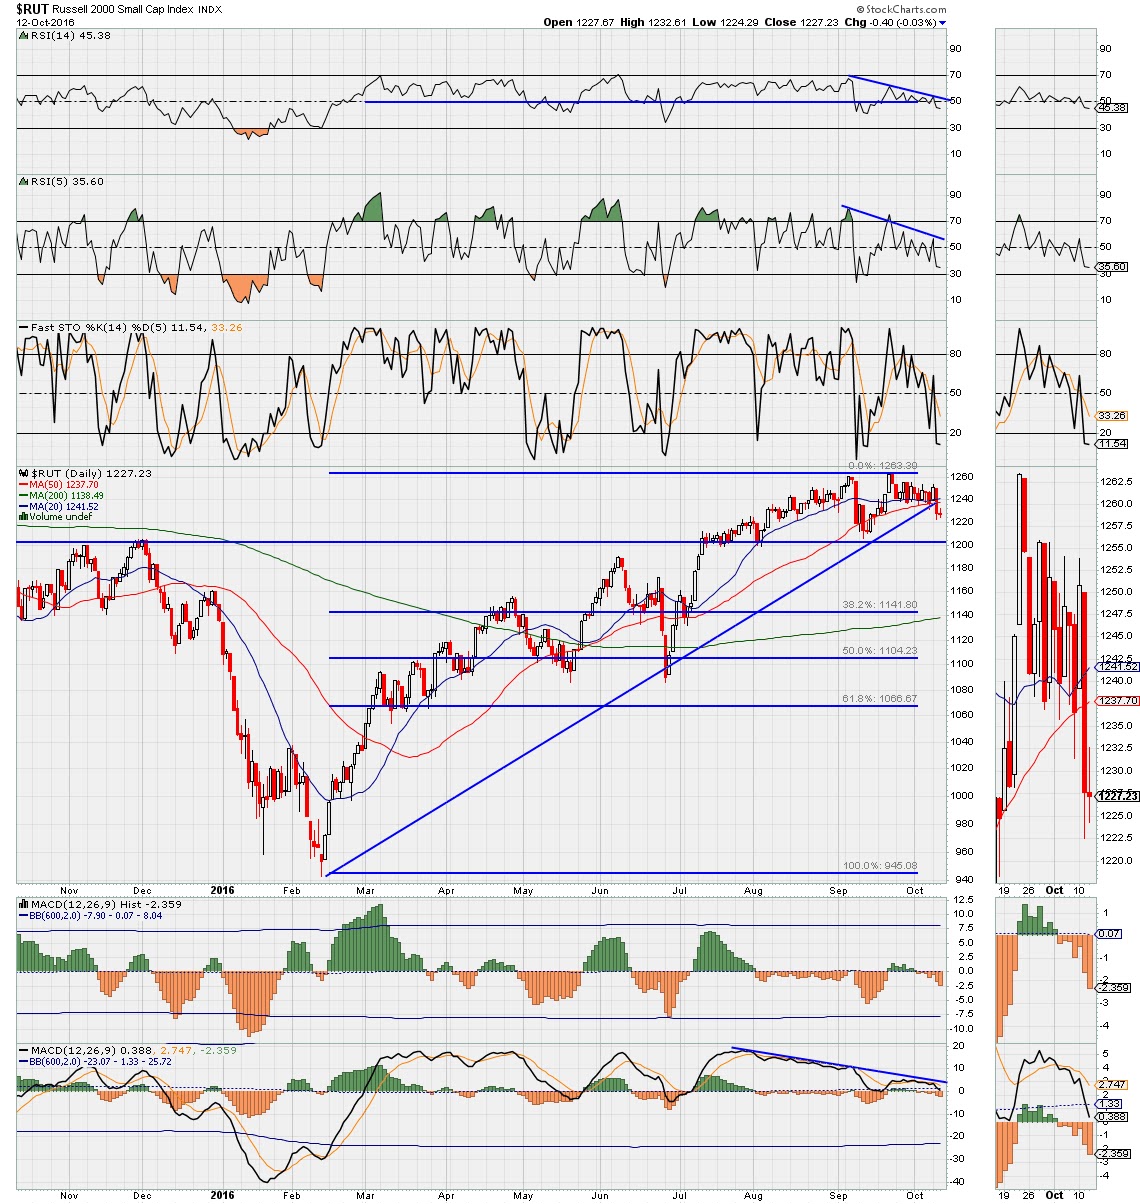
The daily Russell 2000 chart is very interesting. This index has seen the greatest improvement in the slope of earnings (as seen in the models above) and appears to be coiling for a nice breakout. A close above the 1260-1265 range with strong volume could launch this index. The uptrend remains intact. We have taken a small position in ProShares UltraPro Russell2000 (URTY). We are waiting for confirmation before increasing our position. The weekly Russell 2000 continues to show strong upward momentum from the February lows. With momentum improving and the possibility of a 4Q breakout and rally, that is good for stocks in our opinion.


Bottom Line: We expect volatility through the end of the year but are confident that the market can go higher from here. Political factors, monetary policy and economics, earnings trends and technical analysis could be lining up to provide the much anticipated 4Q rally. We are building positions in anticipation with stops in place should our thesis prove incorrect.


Joseph S. Kalinowski, CFA

No part of this report may be reproduced in any manner without the expressed written permission of Squared Concept Asset Management, LLC.  Any information presented in this report is for informational purposes only.  All opinions expressed in this report are subject to change without notice.  Squared Concept Asset Management, LLC is a Registered Investment Advisory and consulting company. These entities may have had in the past or may have in the present or future long or short positions, or own options on the companies discussed.  In some cases, these positions may have been established prior to the writing of the particular report. 

The above information should not be construed as a solicitation to buy or sell the securities discussed herein.  The publisher of this report cannot verify the accuracy of this information.  The owners of Squared Concept Asset Management, LLC and its affiliated companies may also be conducting trades based on the firm’s research ideas.  They also may hold positions contrary to the ideas presented in the research as market conditions may warrant.

This analysis should not be considered investment advice and may not be suitable for the readers’ portfolio. This analysis has been written without consideration to the readers’ risk and return profile nor has the readers’ liquidity needs, time horizon, tax circumstances or unique preferences been taken into account. Any purchase or sale activity in any securities or other instrument should be based upon the readers’ own analysis and conclusions. Past performance is not indicative of future results.