Monday, February 29, 2016

The Earnings Game


We’ve made it through another corporate earnings season. For 4Q15 earnings declined 3.3% year –over-year and revenues declined almost 4% according to FactSet data. A couple of key points that come out of the latest earnings report from FactSet, “Overall, 96% of the companies in the S&P 500 have reported earnings to date for the fourth quarter. Of these companies, 69% have reported actual EPS above the mean EPS estimate, 10% have reported actual EPS equal to the mean EPS estimate, and 21% have reported actual EPS below the mean EPS estimate. The percentage of companies reporting actual EPS above the mean EPS estimate is equal to the 1-year (69%) average, but above the 5-year (67%) average.”

“In terms of revenues, 48% of companies have reported actual sales above estimated sales and 52% have reported actual sales below estimated sales.  The percentage of companies reporting sales above estimates is below the 1-year (50%) average and the5-year average (56%).”

Of particular note, this quarter marks the fourth consecutive quarterly revenue decline for the S&P 500. The last time this happened we were in the throes of the financial crisis in 4Q08 and 3Q09. It also marks the third consecutive quarterly earnings decline, the first time we have experienced such a phenomenon since the first three quarters of 2009.

It appears we are seeing a continuation of earnings being produced on fewer revenues. We have spoken about the mean reverting nature of profit margins (see our post on January 18 entitled Hoping for the Best... but Preparing for the Worst).

The figure below shows what happened to the S&P 500 the last two times profit margins started to roll over.


The current annual revenues per share estimates for the S&P 500 call for $1155.99 in 2016 and $1227.85 in 2017 according to FactSet. Earnings per share are expected to be $121.78 and $137.69 for the S&P 500 for 2016 and 2017, respectively. For these estimates to hold true, we will need to see margins resume its upward trend climbing all the way to 11.2% by 2017. Granted that analysts’ annual estimates are notorious for starting too optimistic and working down over time. This is of some concern because as of today bottom up forecasts are not calling for earnings and revenues growth to resume until 3Q16.  


It also appears that analysts are missing the mark to a greater degree when producing their assumptions. The chart below (found in Business Insider) shows, “volatility for earnings estimates — which are based off either past or expected results — is at its widest in six years, setting up for continued volatility in the market.”


Quoted in that article, UBS equity strategist Julian Emanuel writes, “Looking back over the current cycle, the story isn’t simply about the extent to which consensus expectations have adjusted downward. Instead, the range and inherent volatility (i.e. standard deviation) of the estimates are materially higher, likely setting the stage for material surprises in the event oil and US dollar pressure subside. As with equity market volatility, investors should bear in mind that higher volatility can as easily manifest itself to the upside as to the downside…Putting it all together, we believe that earnings risk remains largely balanced with the potential for upside surprises to "be more surprising" given the historically high volatility and unidirectional (down) aspect of consensus revisions. Paired with historically defensive investor sentiment which has frequently presaged meaningful rallies, we continue to view risk to US equities as skewed to the upside.”
Mr. Emanuel clearly has a bullish bias towards the market. That is perfectly fine, but one needs to understand that this volatility in earnings can go in either direction, which means if estimates are far too bullish we could see an equally aggressive reduction in earnings. We are not predicting that will happen but are cognizant of the potential threats to the portfolio.
Looking at the rolling twelve-month eps forecasts, it appears that we are rolling over as well. Since the end of 2014, 12MF eps has been drifting lower and that hasn’t been great for equities.


This is an important point because the direction of earnings forecasts have a fairly tight correlation with the direction of equities so the one month slope of the earnings forecast line is useful to watch. Bear in mind forecasted earnings are a reactionary lagging indicator so by the time you actually pick up a negative reading in the slope of earnings, the market has already given up a lion’s share of its gains and you’ll be a day late and a dollar short.
Tracking the rate of change in this figure has some use though. The slope of the line has a natural tendency to be positive (as does the stock market) so by tracking the rate of change, we could get a warning even if the slope of the trend is positive but decelerating. This may lead to a bit of noise and false readings but we look at it as a “head’s up” for potential problems. The chart below shows a z-score for the one month slope of twelve month forward forecasts going back twenty years.


When the z-score falls below zero, it indicates decelerating or negative slope and should be used as a warning signal. If the figure recovers quickly then we breathe a sigh of relief and move on with our investment and trading thesis. But once that line continues lower to around -1 standard deviation, bad things happen in the market. The ultimate story here is that we definitely need earnings and revenues to improve dramatically in 2016 to justify a continued bull market. 
Financial Engineering
It seems clear that corporate America has been exploiting financial engineering in order to inflate the bottom line. This can go on for several quarters or even years before reality finally sets in. Given the dwindling results and the excessive levels of earnings tomfoolery one may anticipate the day of reckoning is closer than expected.
Lance Roberts from Real Clear Investment Advice has been highlighting this very situation for some time now. His commentary is brilliant and we personally believe that his analysis is ahead of the curve. On corporate earnings he states, The failure to understand the “quality” of earnings, rather than the “quantity,” has always led to disappointing outcomes at some point in the future.
According to analysts at Bank of America Merrill Lynch, the percentage of companies reporting adjusted earnings has increased sharply over the past 18 months or so. Today, almost 90% of companies now report earnings on an adjusted basis.”


Back in the 80’s and early 90’s companies used to report GAAP earnings in their quarterly releases. If an investor dug through the report they would find “adjusted” and “proforma” earnings buried in the back. Today, it is GAAP earnings which are buried in the back hoping investors will miss the ugly truth.
These “adjusted or Pro-forma earnings” exclude items that a company deems “special, one-time or extraordinary.” The problem is that these “special, one-time” items appear “every” quarter leaving investors with a muddier picture of what companies are really making…Why is this important? Because, while manipulating earnings may work in the short-term, eventually, cost cutting, wage suppression, earnings manipulations, share-buybacks, etc. reach their effective limit. When that limit is reached, companies can no longer hide the weakness in their actual operating revenues. That point has likely been reached.”


Bottom Line: The Corporate earnings picture appears to be deteriorating. That is not a good sign for equities and worth watching closely. We are not predicting a bear market at this point but are cognizant of the pitfalls ahead that could damage the portfolio. In light of the earnings picture, ineffective global monetary policy, slowing global economic growth and a technically broken U.S. equity environment, we continue to believe the lows have not been set and our directional bias remains lower.
Happy Trading.
 
Joseph S. Kalinowski, CFA
Email: joe@squaredconcept.com
Twitter: @jskalinowski
Facebook: https://www.facebook.com/JoeKalinowskiCFA/
 
Additional Reading
The Big Earnings Con – The Felder Report
 
No part of this report may be reproduced in any manner without the expressed written permission of Squared Concept Partners, LLC.  Any information presented in this report is for informational purposes only.  All opinions expressed in this report are subject to change without notice.  Squared Concept Partners, LLC is an independent asset management and consulting company. These entities may have had in the past or may have in the present or future long or short positions, or own options on the companies discussed.  In some cases, these positions may have been established prior to the writing of the particular report.
The above information should not be construed as a solicitation to buy or sell the securities discussed herein.  The publisher of this report cannot verify the accuracy of this information.  The owners of Squared Concept Partners, LLC and its affiliated companies may also be conducting trades based on the firm’s research ideas.  They also may hold positions contrary to the ideas presented in the research as market conditions may warrant.
This analysis should not be considered investment advice and may not be suitable for the readers’ portfolio. This analysis has been written without consideration to the readers’ risk and return profile nor has the readers’ liquidity needs, time horizon, tax circumstances or unique preferences been taken into account. Any purchase or sale activity in any securities or other instrument should be based upon the readers’ own analysis and conclusions. Past performance is not indicative of future results.


Monday, February 22, 2016

Political Uncertainty Can Hurt Stock Prices


Politics is in the air. With the latest results from the South Carolina Republican primary and the Democratic Nevada caucus the field is starting to narrow. On the Democratic side, after fending off and surviving the growing momentum of the Vermont Socialist Senator Bernie Sanders, we anticipate Clinton will build her own momentum going into South Carolina and should start to pull away from this point to be the likely Democratic candidate barring criminal findings due to her mishandling of emails as Secretary of State or conflicts of duty with her foundation while serving.


One the Republican side, the outlook isn’t as clear. In past races it usually came down to the mainstream candidate and the close runner-up usually the evangelical conservative. Think back to 2008 it was John McCain as the mainstream pick with Mike Huckabee hanging on until the end. In 2012 Mitt Romney was the mainstream guy and Rick Santorum coming in a close second. This year we would liken Marco Rubio as the mainstream pick with Ted Cruz hanging on until the bitter end but ultimately conceding defeat to the “establishment” candidate. But then you toss in Donald Trump and the picture gets cloudy. With Trump leading in most of the polls this adds a layer of uncertainty that is sure to affect the market in some way as market participants do not like uncertainty.


It’s a rather sticky situation for Republicans. As the chart above shows, Trump leads the other Republican candidates by a fairly wide margin nationally but as the following charts show, when given the choice of Trump, Cruz or Rubio, Trump is the only candidate that doesn’t match up well against Clinton nationally.    


We will see how this eventually plays out but one would think this could be unsettling for the stock market. I re-read Markets Never Forget – But People Do by Ken Fisher this weekend. Towards the latter part of the book Mr. Fisher shares his insight on historical trends during the entire political process.
Market Turbulence
Mr. Fisher points out, “Again, forecasting markets over the next 12 to 24 months is, in large part, about shaping a set of likely outcomes, understanding what most people expect, and then understanding how divorced expectations are from that likely future reality, for good or bad.
This is why markets can soar on lackluster economic growth or lower corporate profits. This is why markets can have a lousy year even if economic growth is strong. It’s not about what happened or what you hope happens. It’s about what most people were expecting and how they react when a better – or worse – than – expected reality plays out.”
The logic seems to make sense and he goes on to apply the theory to risk aversion and Presidential cycles. He writes, “Table 7.1 {I have recreated it below} divides returns into first, second, third and fourth years of each president’s term. For now ignore individual years; just look at the averages. First and second years average 8.1% and 9.0%, while third and fourth average 19.4% and 10.9%.
Interesting enough pattern. Now look at individual years. The back half of presidential terms – years three and four – are nearly uniformly positive. Year three doesn’t have a single negative since 1939, which was barely negative. Year four has just four down years. And returns are not always but frequently are double-digit positives.”


Bear in mind this book was written several years ago and it turns out President Obama’s third year of his second term, last year was negative. That said the historical relevance holds. Mr. Fisher goes on to explain this phenomenon with a fundamental backdrop.
“And here, there’s an excellent fundamental explanation – tied to when legislative risk aversion is increasing or decreasing. Legislation – no matter how it’s couched or how many thousands of pages it’s on – typically results in a redistribution of money, property rights or regulatory changes…Vast amounts of academic research proves humans hate losses more than twice as much as they like gains; i.e., a 25% gain feels as good as a 10% loss feels bad. That’s true for Americans. For Europeans, it’s even higher. So when the risk of legislation increases – as it typically does in the first two years of a president’s term – those who lose out hate losing much more than those who benefit from it like benefitting. Because we do it openly and publically, it feels like a mugging, and anyone not directly involved fears they’ll get mugged next – leading to heightened risk aversion overall and more variable returns with worse averages – just as you see in Table 7.1. But when legislation risk aversion decreases – as it typically does in years three and four – stock returns historically have been more uniformly positive.”    
The question arises as to why legislation risk aversion is more prevalent in the first two years of a presidential cycle. Mr. Fisher explains, “They know in the history of modern presidents, the president almost always loses some relative power to the opposition party in mid-term elections…Therefore, the president knows that whatever he would pass that is most monumental – the crown jewel of his administration – must be passed in the first two years of his term (I say his because they’ve all been male so far), because he’ll likely face a bigger uphill battle in the back half when he loses relative power.”
Indeed it has been said that the stock market favors “gridlock” and the results in table 7.1 establish that notion. Let’s speak a bit about a sitting presidents fourth year going into a new first year, as we are this year. Mr. Fisher writes, “Republican politicians see themselves as more pro-business. When they campaign, they say business-friendly things and promise business-friendly reforms – and markets typically like that. Democrats are seen as less business friendly, more interested in non-market oriented social causes. Markets like that less. So election years (year four) when we elect a Republican, stocks rise 15.6% on average, but only 6.7% when we elect a Democrat. (See Table 7.2) Simple fact – other things being equal – if you knew in advance we would elect a Republican president, that might be extra motivation to be more bullish election year than if you knew in advance we would elect a Democrat...When we elect a Republican, the market does great in the election year but not so well in the inaugural year. And just the reverse – when we elect a Democrat, the market does less well in the election year but pretty darned well in the inaugural year.”


He goes on to explain why this anomaly exists. “The moment a Republican gets elected, he’s no longer a candidate, but president, and he starts thinking about re-election. He needs independent voters and marginal Democrats to get re-elected – he knows his Republican base has nowhere to go. A Republican president can’t ride on a wave of deregulation, lower taxes or whatever it was he promised…Markets discover he’s not as pro-business as they hoped. He isn’t their pro-business champion. No, he is, rather, just a politician, so a Republican’s inauguration year is more variable, averaging just 0.8%.”
“But the Democrat! He’s just a politician too. He came in vowing to go after Wall Street fat cats and fight for the little guy – which scared the dickens out of markets in the election year – contributing to lower election year market averages. But he wants to get re-elected too, and doesn’t want to annoy Wall Street fat cats (who make a lot of campaign contributions). He, too, must move to the middle if he is to have a hair of a chance at re-election. It’s the middle that makes the decisions. Markets then are pleasantly surprises the Democrat isn’t quite so business-unfriendly as they feared, and the first year of a Democrat’s term, they average 14.9%”
The figures become even more fascinating in election cycles in which the incumbent president isn’t running. This is what we face this year.
“Markets typically do well when we elect a Republican in the election year and fear a Democrat. But that effect is magnified in first-term elections and diminished in second term elections. When we newly elect a Republican, the markets have especially high hopes – stocks have averaged 18.8% in those years (see Table 7.3). And a newly elected Democrat is even spookier – stocks average -2.7%.”


“Markets are really relieved the newly elected Democrat isn’t an out – and – out socialist – rising an average 22.1% his inaugural year. Whereas the not – so – business – friendly – as – hyped newly elected Republican sees stocks fall an average -0.6% his inaugural year.”


A Unique Election Year
Just a few short months ago it appeared we were setting up the field for a showdown between two “establishment” candidates. Like setting up a chess board most were expecting a Clinton vs. Bush race to the white house. If that were the case then everything we’ve discussed above would seem pretty cut and dry. We know just from looking at the Clinton campaign logo (the “H” with a big red arrow pointing right) that she would gravitate to the center once nominated and Bush is…well…a Bush.


Fast forward to today and we find Clinton is barely able to squeeze out victories against Sanders, the Vermont socialist that was little more than a political sideshow at the start of the race and Bush dropping out unable to gain any traction with his campaign. That chess board that we set up turned into a game of chutes and ladders.
Perhaps the voting public is on to the political game that has taken place for so long. Given the most outlandish proposals, such as building a great wall and having Mexico pay for it or giving everyone free everything financed by those of us that work on Wall Street, their political wherewithal is astonishing. The appeal for voters is the sincerity behind these candidates’ proposals regardless of its feasibility. People just appear to be sick of typical politicians.   
This is bad news for the stock market. There are several layers of uncertainty in this race and in my opinion unprecedented voter angst at least in my generation (born 1970’s).
There are several reasons why we believe the stock market has yet to hit the lows for the year – slowing global economic growth, weakening corporate earnings and a technically broken stock chart that is signifying a new downtrend. Under normal circumstances I would say that in the end this would hurt Clinton’s chances at the presidency as she is running on a third Obama term when the voters are clearly calling for something different. Given her baggage from the State Department and a slowing economy and weak stock market this would appear to be a layup for Republicans if it wasn’t for the mass chaos that exudes from the GOP almost on a daily basis.
Again this is bad for the market.
What the Market is Telling Us
According to an article entitled What You Should Know About the Markets in 2016 found on the AARP website, “The stock market has gained an average 5.8 percent in the fourth year of a president's term since 1833, says Jeff Hirsch, editor of the Stock Trader's Almanac. But the picture is not as clear in a president's eighth year. The Dow Jones industrial average has lost an average 13.9 percent in a full two-term president's final year since 1900 (there have been only six), Hirsch says. By the end of a second term, Wall Street senses change in the air. Wall Street hates change.”
He goes on to predict the following, “In 2016, the stock market might be a better indicator of who is going to win the election than the election will be an indicator of how the stock market will fare, says Sam Stovall, the U.S. equity strategist for Standard & Poor's Capital IQ. "If the market is up between July 31 and Oct. 31, then 8 times out of 10, the incumbent party is reelected," Stovall says. "If it's down, the incumbent party is replaced."”
We came across another article in The New America entitled Stock Market Is Predicting a Republican President. In the article they write, “Mark Hulbert’s study of correlations between the stock market and presidential elections and Jeff Hirsch’s Stock Trader’s Almanac are making a powerful case that, come November, it will be a Republican occupying the White House for the next four years… According to Hulbert, the correlation between the stock market and presidential elections is remarkable: “A strong stock market is correlated with the incumbent party winning. A declining stock market is associated with a change in parties at 1600 Pennsylvania Avenue.” To cover himself, Hulbert notes that “correlation is not causation” and that the conclusion is “suggestive [rather] than conclusive.” But with stocks down hard so far this year — the Dow Jones Industrial average is down eight percent for the year, while the Standard and Poor’s 500 Index is down nine percent and the NASDAQ is off 14 percent — the market is going to have to reverse itself mightily to keep a Democrat in the White House.”
“Since 1920, according to Hirsch, the eighth years of presidents serving two terms have experienced the worst stock market performance, with the Dow, on average, losing 14 percent and the S&P 500 showing average losses of 11 percent. The market showed losses in the final year of an eight-year term five times out of the last six two-term administrations.
It gets worse for the Democrats. Hirsch’s January Barometer shows that as the first five days of trading goes, so goes the market for the year. And if January itself is down, then it bodes ill for the market for the rest of the year as well.
One need not be reminded that the first five trading days of 2016 were the worst opening week in stock market history.”
There also appears to be a level of excitement and urgency from the Republican side that isn’t quite there on the Democratic side. “The groundswell was noted in both the Iowa and New Hampshire primaries by Stephen Dinan in the Washington Times: Republicans set a new turnout record Tuesday in New Hampshire’s primary, attracting more than a quarter of a million voters to the polls and offering evidence that most of the energy in the 2016 presidential race continues to be on the GOP side….The New Hampshire results follow last week’s Iowa caucus turnout, where Republicans easily outdistanced Democrats by more than 50 percent.”
Beyond The Presidential Cycle
There has been some interesting work done on presidential cycles and the stock market. One such paper that I read recently is Stock Market, Economic Performance, And Presidential Elections. This paper was written by Wen-Wen Chen from State University of New York at Old Westbury, Roger W. Mayer from Walden University and Zigan Wang from Columbia University.
They found, “GDP growth rates under Democratic administration in the second, third, and the fourth years are greater than growth under a Republican administration. The difference in the second year has enlarged since 1953, while the differences in the third and fourth years have shrunk during the second half of the 20th century. The average cumulative GDP growth for four years under Democratic administration is 18.51 percent since 1900 and 15.33 percent since 1953, while under Republican presidents the numbers are 10.71 percent and 11.21 percent, respectively (see Figure 1).”


They go on to conclude, “The authors’ study adds to the literature on examining the relationship between a presidential administration and the economy. The researchers demonstrated that GDP growth is associated with the prediction of the Wall Street, as defined by the change in stock price immediately after the election. This relationship has strengthened over time. The researchers were not able to identify the same relationship between stock market change immediately after an election and unemployment. The divergent results may be explained by the political economy framework and the strong relationship between business and the presidential administration. Given that the focus of business is on growth and not full employment, these results suggest that when Wall Street casts its prediction after an election, the prediction focuses on growth and excludes unemployment variables. Additional research is needed to determine how GDP, unemployment, and presidential policies interrelate.”


“Table 4 shows six regressions of which (1), (2), and (5) show the results of a sub-sample of the most recent ten administrations from Richard Nixon/Gerald Ford in 1972. Models (1) and (2) show that for the most recent ten administrations, the 1-day DJI percentage change following the Election Day is a significant predictor of the cumulative GDP growth of the following four years. However, Models (3) and (4) show that the prediction has no significant accuracy when all 28 administrations since 1900 are included. Models (5) and (6) show that the 1-day DJI percentage change following the Election Day and the average unemployment rate of the following four years has no correlation in both the sub-sample and the full sample.”


Thus in more recent history, the action of the stock market almost immediately after a presidential election has predictive ability in telling us about economic growth over the next several years. This should be interesting to see if the market will gain traction and resume its bull trend prior to the election, when the election dynamics itself may be increasing uncertainties that ultimately hurt the chances of a new uptrend.
In the end we do care about the political spectrum as it relates to finance and the economy. We have written in the past about political issues that we care deeply about.
November 26, 2015 - Revitalizing the American Dream
September 13, 2015 - Shackling The Invisible Hand
November 19, 2014 - Power Dinner
November 4, 2014 - Irresponsibility in Government
That said, it is just one aspect that we attempt to analyze when constructing and trading our portfolio and not necessarily a large input.
Bottom Line: The current political picture is adding a layer of uncertainty around the market and that could impact prices negatively. We believe that the deck is stacked against Clinton at this point for several reasons (1) lingering ethics questions from her time at State, (2) disenfranchised Sanders supporters if she gets the nomination (I say if due to the ongoing FBI inquiries – not because I think Sanders will get the nomination), (3) low “likeability” and “trustworthiness” rating, (4) weaker global economic and US growth and a stumbling stock market, (5) running on an Obama third term platform when much of the voting public are looking for change.  What should be a shoe in for Republicans is blocked by chaotic campaigns, too many candidates and the Trump Wild card.
 
Joseph S. Kalinowski, CFA
Email: joe@squaredconcept.com
Twitter: @jskalinowski
Facebook: https://www.facebook.com/JoeKalinowskiCFA/
Blog: http://squaredconcept.blogspot.com/

Additional Reading


No part of this report may be reproduced in any manner without the expressed written permission of Squared Concept Partners, LLC.  Any information presented in this report is for informational purposes only.  All opinions expressed in this report are subject to change without notice.  Squared Concept Partners, LLC is an independent asset management and consulting company. These entities may have had in the past or may have in the present or future long or short positions, or own options on the companies discussed.  In some cases, these positions may have been established prior to the writing of the particular report.
The above information should not be construed as a solicitation to buy or sell the securities discussed herein.  The publisher of this report cannot verify the accuracy of this information.  The owners of Squared Concept Partners, LLC and its affiliated companies may also be conducting trades based on the firm’s research ideas.  They also may hold positions contrary to the ideas presented in the research as market conditions may warrant.
This analysis should not be considered investment advice and may not be suitable for the readers’ portfolio. This analysis has been written without consideration to the readers’ risk and return profile nor has the readers’ liquidity needs, time horizon, tax circumstances or unique preferences been taken into account. Any purchase or sale activity in any securities or other instrument should be based upon the readers’ own analysis and conclusions. Past performance is not indicative of future results.


Tuesday, February 16, 2016

Rally Time...Stocks go higher for the remainder of 1Q16


For the most part we have spent 2016 on the short side of the market. On Friday we decided to take off all of our short positions in our trading account and are waiting for signs of a follow-through of Friday’s rally to take a long position once again. We were a bit surprised that the market retained its gains heading into a three day weekend but the market proved resilient, albeit on low volume. News on the oil front about production controls has the market in full risk-on mode this morning. Here are a couple of near term items that lends itself to a rally from here.

Item #1: The economic picture has improved slightly putting into question the worries of a U.S. economic recession. From Business Insider, “Retail sales jumped more than expected in January, up 0.2%.

Excluding autos and gas, the advance estimate from the Census Bureau showed that retail sales rose 0.4% compared to December. And, the retail sales control group, which feeds into GDP calculations, rose 0.6%.”


Consumer sentiment remains relatively stable as well. “Over the last few weeks, concerns had mounted that the recent market turmoil would soon dampen consumer confidence and spending.
But consumer sentiment remains at a relatively elevated level, even after the unexpected drop in the University of Michigan's index to 90.7. And as TD Securities' David Tulk argued in a note to clients, it's still too soon to tell whether the sell-off in stocks will be followed by an economic downturn.
A downturn in stocks can be a leading indicator of economic activity but doesn't serve as one on a consistent basis.” (Business Insider).
This is positive news in the face of deteriorating stock returns and the negative wealth effects it can have on the consumer. One possible explanation comes from  Deutsche Bank's Torsten Sløk. He states (via Business Insider), “Many are worried about what the hemorrhaging stock market could mean going forward for the overall economy.
But Deutsche Bank's Torsten Sløk argues that the negative wealth effect on the economy caused by investors freaking out about turbulence in the markets shouldn't be too huge because middle income consumers are feeling good.
In a recent note to clients Sløk wrote that, generally speaking, an increase in wealth has a greater impact on consumer behavior than a decline in wealth.
"Given how small the positive wealth effects have been over the past seven years then it would be a surprise if the negative wealth effects are big, in particular in a situation with consumer sentiment for middle income groups rising in January and at levels higher than in 2005 — 2006," he argued.
"Put differently, the lack of a slowdown in the broader macro data including consumer sentiment, the unemployment rate, the quits rate, job openings, hours worked, wage inflation, and jobless claims [Thursday] morning, suggests that the negative wealth effects are indeed going to be limited," he continued.”


Additional information from XE blog also shows things may not be as bad as feared on the economic front.
They state, “Recent market and statistical weakness has led to increased discussion of a possible US recession.  In this column, I will argue that instead of a recession, we’re facing a situation similar to the mid-1980s, where the economy also experienced slowdown caused by high oil prices, a strong dollar slowdown and weak oil sector.  But there is insufficient weakness – largely thanks to continued housing market strength and recent wage growth – for a recession to occur.”
When looking at the quarter over quarter economic growth figures, “Between 1Q15-4Q15, personal consumption expenditures (PCEs) fluctuated between .6% and 3.9% Q/Q growth.  Durable goods purchases varied between 2%-8% growth – an encouraging pace.  And service spending was constant, with numbers seesawing between 2%-2.7%.  Investment is where problems emerge.  Non-residential structural spending contracted in 3 of the last 4 quarters; spending on equipment was weak in 2Q14 (.3% increase) and contracted in 4Q15.  But residential investment grew strongly in all four quarters.  And finally, we have exports, which contracted in 2 of the last four quarters.  The Q/Q numbers show modest growth, with the weak oil/gas extraction market and strong dollar hurting growth.”


Using the same metrics and analyzing year over year figures they write, “Topline PCE growth recorded levels between 2.6%-3.3% for the last 4 quarters – a decent pace of growth.  Consumer durable goods expenditures were very strong, vacillating between 5.2% and 7.3%.  As with the Q/Q figures, Y/Y business investment numbers were weak; non-residential structural investment declined in 3 of the last 4 quarters.  But residential spending increased at a solid pace.  And exports declined in the 2H15.  So, like the Q/Q numbers, we again see evidence of industrial and export weakness.”


When speaking to leading and coincident economic indicators, “The LEIs have printed either 0 or negative readings in 4 of the last 7 months while the CEIs have printed between .1 and .3 (top table).  But while the lower table shows a slowdown in the LEIs 6 month rate of change, the CEIs increased.  Here is the conclusion reached by the Conference Board’s economists
The Conference Board LEI for the U.S. declined in the final month of 2015, with its six-month growth rate decelerating. In addition, the strengths among the leading indicators are now balanced with the weaknesses. Meanwhile, the CEI has continued rising slowly, and as a result its six-month growth rate is higher than in the first half of 2015. Taken together, the current behavior of the composite indexes and their components suggest that while risks to growth have increased, although not significantly, the expansion in economic activity should continue at a moderate pace in the near term.
In theory, LEI weakness should translate into CEI weakness.  When that doesn’t happen, it is more likely than not that a recession isn’t likely.
The reason for the current slowdown is a combination of weak international growth, a strong dollar and weak oil prices.  The economy faced the exact same set of facts in the mid-1980s.”


Item #2: There has been heavy shorting of the stock market from hedge funds and at least in the near term much of the negativity surrounding interest rates, oil prices, corporate earnings, slowing global economic growth etc. may be reflected in prices. Again we state that this is a near term phenomenon. We continue to believe there exists the potential for the market to drop significantly lower from these levels. That said, any bit of positive news (oil production, Fed dovishness, additional QE from global central bankers) could spark a near term rally that could start a short squeeze and higher equity prices.
Citing a story from ValueWalk, “Behavior at market lows is always interesting, and the February 9 notes that $59 billion of net shorts that have been added in S&P 500 futures over the past 30 trading days. Who has been engaged in this selling? It is a key alternative investment category, among the biggest users of futures, who got short recently.
“On our books over the past two weeks, it has been Hedge Funds that have seen a significant shift towards short positioning,” the Morgan Stanley report said. “The % of Hedge Funds that were short S&P 500 futures as of Friday’s close was the greatest it’s been since the week of September 11, 2015 and, prior to that week, since the fall of 2011.”
In the relative value camp, the report noted on Monday’s close, US Long/Short Net Leverage returned to post-crisis lows. Looking from a different perspective, gross leverage remains 14-15% above its ‘10/’11 troughs, the report noted.”


“On a short term basis, Morgan Stanley’s “Pain Monitor,” measuring open interest, it touching a historic mean reversion point. On a fundamental level, often times when a trend ends market participants will have exhausted a significant directional capacity to contribute to price persistence. In many cases this leads to a mean reversion point.
Looking at the “Pain Monitor” exposure level mean reversion opportunities appear to exist in other markets, not just the S&P, setting up some interesting correlation trades.
David Rosenberg seems to agree. In his latest note to client he states:
One last item to note which is sentiment (that wonderful contrary indicator at extremes). The Investor’s Intelligence survey just came out for the past week and the bull camp retreated to a five-month low of 24.7% from 34%; and the bear share edged up to 39.2% from 27.9%. So the bull/bear spread widened out to -11.1 from -4.1 which indeed is a step in the right direction for those seeking a near-term tradeable rally at the very least. This takes out the -10.4 level hit last summer and not far off the-11.9 reading reached in 2011 that presaged a nice bounce back at the time as the shorts ran for cover. Remember, the large positive spread in favor of the bulls (+43.5 in April) touched off this severe corrective phase. What goes around comes around.
 Indeed, the latest Commitment of Traders Report shows there now to be an eye-popping 46,738 net short S&P 500 contracts on the Chicago Mercantile Exchange … surging four-fold so far this year to the highest level since late November, 2011.”


Item #3: The transportation sector seems to be catching a bid. According to the latest Cass Freight Index Report, “The number of freight shipments and the dollars spent on freight have been in a typical seasonal decline since September 2015. Our shipment index opened the year just 0.2 percent below last January, while the expenditures index is down 1.4 percent. The economy grew much more slowly in the second half of 2015, so January freight shipments are down 11.6 percent and dollars spent are down 11.5 percent from the June 2015 high. The declines in the fourth quarter and again in January are normal seasonal trends and are not necessarily signs of further weakening.”


On shipment volumes, “Year over year, freight shipments were essentially flat from last year, just 0.2 percent lower than last January. Sequentially, January was the fourth month in a row that the number of freight shipments declined. The Association of American Railroads (AAR) reported that carloads were down 20.6 percent, while intermodal loadings fell 11.9 percent over December 2014. The AAR attributed the decline to soft economic conditions in the U.S. and globally. The continued steep decline in energy prices hurt the railroads on several fronts in January. First, it caused a dramatic decline in coal shipments, one of their primary commodities, as power generating plants continue to shift to less expensive natural gas. Second, a drop in petroleum and petroleum products shipments as oil mining came to a virtual standstill in the U.S. And third, there has been a loss of shipments of materials used in petroleum extraction. Truck tonnage also eroded in January, but not to the same extent as railroads. Carriers are reporting that capacity and demand are very well matched right now.”
On freight expenditures, “The freight payment index fell 1.9 percent in January (from December), and is 1.4 percent below the January figure in 2015. The decrease in January 2016 is much less than the December to January drops of 5.7 percent in January 2015 and 5.1 percent in January 2014. The decrease can be mainly accounted for by the drop in the number of shipments and the mix of commodities moved. Generally speaking, rates were stable in January because available capacity was not a problem.”
They go on to summarize, “The Institute of Supply Management’s (ISM) monthly PMI Index Report in January showed that although the PMI Index remained below the 50 percent threshold—indicating that manufacturing is contracting—the index rose for the first time in four months. The 0.4 percent increase is a sign that manufacturing may be reawakening. The Production Sub-index rose 0.6 percent, along with a healthy 5.5 percent increase in the New Order Sub-index. If manufacturing continues to grow—and it should—freight levels will return. Although factory employment has been hit hard by weak exports, job hires were up 29,000 in January.
The Labor Department released figures recently showing another decline in unemployment, which fell to 4.9 percent. Even better news for the economy is that there was a half a percentage point gain in average hourly earnings in January. This, coupled with the growth of wages in the second half of 2015, should increase consumer spending, giving the economy another boost. Wages have grown more in the last six months than in any other time since the recovery began over six years ago. The number of new jobs created in January was much lower than in December, but much of this is due to the hiring of seasonal workers.”
It’s not quite a ringing endorsement on all things moving but certainly not gloom and doom.
In fact the transportation industry could be on the verge of a major bottom as pointed out in See It Market. They write, “To give you an idea, the Dow Jones Transports is down over 20 percent in the last 12 months, having fallen over 30 percent from the late 2014 highs to January 2016 lows.
Below is a chart looking at the Dow Jones Transportation Average/S&P 500 ratio over the past 10 years. The ratio shows that the Dow Jones Transports has been much weaker than other stock market averages over the last year.”


“After hitting channel resistance at point (1) a year ago, the Dow Jones Transports declined nearly declined as hard as it did during the 2009 collapse. This decline took the Transports relative strength down to channel support at point (2), where a small rally has now taken place off the January lows. This could simply be a bounce, but it is reflecting some relative strength against the broader markets… for the first time in a year.
Below looks at the Dow Jones Transports Index  As you can plainly see, it has been a painful decline.
The decline over the past year has taken the Dow Jones Transports from channel resistance back down to its rising trend support at point (1). This major support level also happens to be the 38 percent Fibonacci retracement level as well (of the 2009 lows/2015 highs). As the Dow Transports Average was hitting this confluence of support a few weeks ago, it also created a reversal candlestick at point (1).”


A rebound in the transportation sector could act as positive reinforcement for the greater markets that a recession isn’t likely and this pullback should be considered a correction. At the very least it may provide a brief short term tailwind for the markets.
Item #4: The percent of companies in the S&P 500 that are in a bullish point and figure formation are extremely low and are signifying the possibility of a near term bounce. Currently only 29.8% of the companies in the S&P 500 are in bullish point and figure formations (and this is after the rally on Friday, on Thursday the figure was 27.6%). Typically when this figure falls below 30% it represents a near term bottom in the market.


We have been tracking this data since the early 1990’s and there have been a few occasions when this metric was this low. The good news is that this is a strong indication that a tradable bottom is available in the near term. The bad news is that once this signal is initially met, there is a pattern of more to come and the market has usually gone lower from that point. In a word this metric becomes active in pinpointing short term rallies in a down trending market. It gave us several tradable rallies starting in late 4Q 1998, 3Q 2001, 2Q 2002 before finally bottoming in 1Q 2003. It also registered in 1Q 2008 for a tradable rally then giving us another reading in 1Q 2009. As one can see from the start of the first tradable bounce to that last the market got destroyed both times. Only in 3Q 2011 did the initial reading pick the bottom.
In 3Q 2015 we got our first reading for a tradable rally and now this past week we got a reading for 1Q16. This may be the final reading in this correction but given the technical damage to the market it’s hard to imagine the lows have been set.
Item #5: There appears to be bullish divergences all over the daily chart for the S&P 500. All the oscillators that we track are oversold and exhibiting a bullish divergence. The MACD, percent in bullish point and figure formation, percent of companies above their 50 and 200 day moving average and percent new hi/lo all exhibiting a bullish divergence. This adds to the trading thesis that we are expecting a near term bounce in the market. On the weekly chart all measures are oversold. We believe that if the rally from the daily metrics are strong enough to spark and improvement in the weekly metrics, we could see a sharp rally into the end of 1Q16 and into 2Q16.
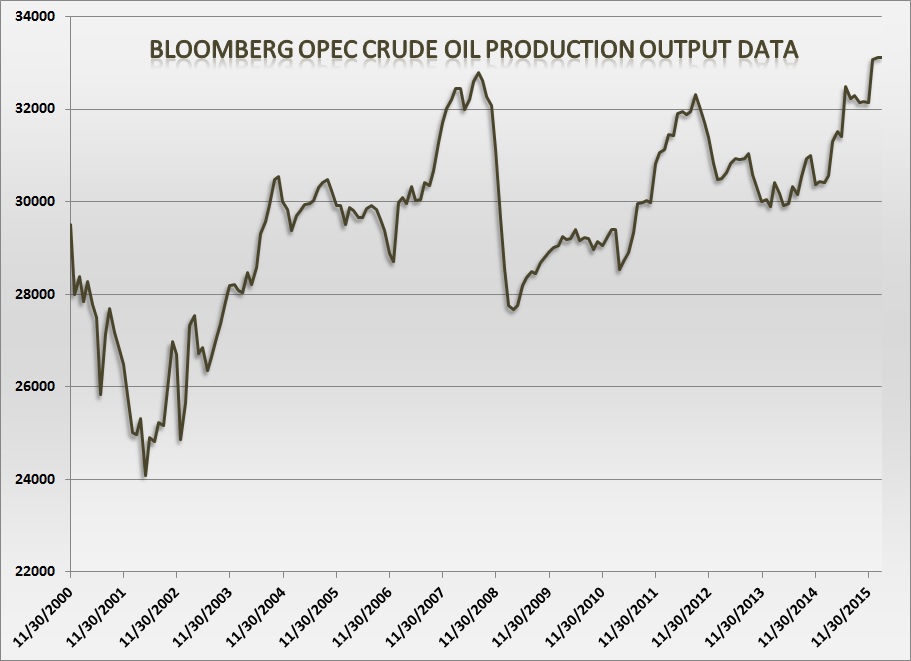


Item #6: Oil prices have stabilized. This news is breaking as I write this analysis. According to a note I just received from Seeking Alpha, Russia, Saudi Arabia agree to freeze oil output.
They summarize:
“Top oil officials from Russia, Saudi Arabia and several key OPEC members have agreed to freeze crude output at January levels at a meeting in the Qatari capital Doha, targeting a supply glut that's sent prices to 13-year-lows.
According the International Energy Agency, Saudi Arabia produced 10.2M bpd last month, below its most recent peak of 10.5M bpd set in June 2015. Russia produced nearly 10.9M bpd in the same month, a post-Soviet record.
Oil soared almost 6% ahead of the meeting - on expectations of a more weighty announcement - but pared gains following the news. Crude futures +1% to $29.72/bbl.”
We think this could prove a nice tail wind for the market in the near term as the correlation between oil prices and equity prices have been higher than normal recently. The next chart found in an article entitled Oil Is the Cheap Date From Hell found in BloombergBusiness shows that correlation.


The article states, “History is a useful guide. So far this year, the S&P 500 is moving in closer tandem with West Texas Intermediate, the benchmark U.S. crude oil, than in any year since 2000 except for 2010. The reasons for the high correlation in 2010 were similar: abundant oil supplies and fears about global growth. Interestingly, around the second week of February 2010, the mood turned. The correlation continued, but with oil and stocks both rising instead of falling.”
Given the large shorting activity around oil prices we could see a short squeeze in oil that will benefit stock prices should the relationship hold.


True U.S. oil production has leveled off and rig counts have been dropping heavily. The question arises as to OPEC’s ability to adhere to production cuts. Many experts don’t think so.


From Business Insider, “Most recently, on Thursday, The Wall Street Journal's OPEC correspondent Summer Said tweeted: "OPEC is ready to cooperate on a cut, but current prices are already forcing non-opec producers to at least cap output, says UAE Energy min."

But the Kingdom might not be ready to fold just yet.

"Possible ongoing talks on coordinated OPEC and non-OPEC crude oil production cuts are unlikely to be successful in the near-term, in our view," argued BAML's MENA economist, Jean-Michel Saliba, in a recent note to clients.

"Saudi Arabia appears to be continuing in the meantime to position its energy and fiscal policies for a lower for longer oil price environment, if need be, as suggested by the possible flotation of Saudi Aramco or parts thereof."

And Saliba writes that if the oil behemoth does go public, it "would be a landmark event."

"We believe that a potential IPO of Saudi Aramco ... could assuage key macro concerns regarding unsustainable debt accumulation and Fx reserves drawdown," he wrote.

"It also would confirm the economic reform credentials of the current Saudi administration and its financial preparedness for a potentially prolonged period of low prices, in our view."

Saliba also argues that the conservative oil-price assumption in the Saudi's 2016 budget also suggests that the Kingdom is "unlikely to capitulate on its energy policy as the adjustment is being carried on the fiscal front."”

They go on to state, “Moreover, he writes that it may not even be that compelling for the Saudis to cut in the short/medium term (emphasis ours):


We have suggested that, in the short-term, a unilateral cut from Saudi Arabia appears a marginally revenue-positive move. This could leave it indifferent between a unilateral cut and no cut, partly as other oil producers would free-ride and encroach on Saudi’s market share.


This "indifference" arises because a 1mn bpd cut would increase the fiscal breakeven oil price by US$10/bbl and, concurrently, broad elasticity measures would suggest a US$10-12/bbl move upwards in oil prices. However, the elevated starting level for the fiscal breakeven oil price restricts such a policy, given the budgetary flexibility required of a swing oil producer. In the medium-term, unilateral cuts would likely be unambiguously revenue-negative as both the supply and demand curves would respond to higher oil prices.”


“And, finally, another interesting idea to consider is what the "signaling impact" of such a coordinated cut could be — and how the Saudis may interpret this. "Headlines on joint cut discussions have already managed to talk up oil prices. Elasticities may likely be non-linear, suggesting a more marked impact on prices from output cuts at low oil prices," he writes.

"This suggests difficulty to control the extent of the oil price rebound, which could be used by non-OPEC producers as a lifeline to initiate hedges or obtain additional financing," he adds.

In any case, ultimately, Saliba believes that the Saudis are "best placed" to sit through the lower oil prices if there won't be coordinated policy action.”


We closed our short positions and booked profits for the start of 2016. While we still believe the longer term trend for the market is lower we understand that there will be reflex rallies on the way down. We believe the market has washed out in the near term and lends itself to a rally that could take the market higher for the remainder of 1Q16 and into 2Q16 before resuming its downward trajectory.

We cite “less negative” economic figures, excessive short positions in stocks and oil, improving price action in the transportation sector, excessive negativity in the S&P percent of bullish P&F formation, bullish divergences on the daily SPX chart and oversold conditions on the weekly SPX chart and oil stabilization.

We didn’t mention easing monetary policy as Mario Draghi spoke this weekend with dovish comments and we expect the Fed to soften their language over time as well.

Bottom Line: We are going aggressively long here for the first time since November of last year. We think there could be a powerful rally from these levels but continue to believe the market lows for the year have not been set. We are looking for a strong rally to end February and March. Come the second and third quarter of the year we could see weakness again and we believe this is going to be the summer to short the market. By the third and fourth quarter hopefully this downward trend will bottom.

Joseph S. Kalinowski, CFA

Email: joe@squaredconcept.com

Twitter: @jskalinowski

Facebook: https://www.facebook.com/JoeKalinowskiCFA/

Blog: http://squaredconcept.blogspot.com/


Additional Reading


Weekly Market Summary – The Fat Pitch


$100 Trillion Up in Smoke – Mauldin Economics


No part of this report may be reproduced in any manner without the expressed written permission of Squared Concept Partners, LLC.  Any information presented in this report is for informational purposes only.  All opinions expressed in this report are subject to change without notice.  Squared Concept Partners, LLC is an independent asset management and consulting company. These entities may have had in the past or may have in the present or future long or short positions, or own options on the companies discussed.  In some cases, these positions may have been established prior to the writing of the particular report.

The above information should not be construed as a solicitation to buy or sell the securities discussed herein.  The publisher of this report cannot verify the accuracy of this information.  The owners of Squared Concept Partners, LLC and its affiliated companies may also be conducting trades based on the firm’s research ideas.  They also may hold positions contrary to the ideas presented in the research as market conditions may warrant.

This analysis should not be considered investment advice and may not be suitable for the readers’ portfolio. This analysis has been written without consideration to the readers’ risk and return profile nor has the readers’ liquidity needs, time horizon, tax circumstances or unique preferences been taken into account. Any purchase or sale activity in any securities or other instrument should be based upon the readers’ own analysis and conclusions. Past performance is not indicative of future results.