
The energy sector seems a bit interesting here. On the daily
XLE chart the ETF has reached a key support level that has held a few times
now. It also coincides with the 38.2% Fibonacci retracement from the early 2016
lows. It appears we are close to a bullish MACD cross. If we do get the cross
it will also mark a bullish MACD divergence. This is a pattern that we like to
trade and has offered a few good entry points in the past (see Rally
Time...Stocks go higher for the remainder of 1Q16).

We also came across this article in Stockcharts.com written
by Greg Schnell, Natural
Gas And Oil Stocks Get Interesting Here.
He writes, “Natural
gas was picking up a bullish tone on Friday as it tried to move up to the top
of a 2-week trading range. However, Monday moved it back down to the bottom of
the range. The typical Natural Gas stocks did not follow the move back down to
two weeks lows at the time of writing. I'll just use XOP for this chart.”

“Oil broke 1-year
trendlines last week with a big down candle Thursday.”

“On Friday it created
a hammer candle and all of the energy stocks soared.”

“Monday gave back most
of the bounce in oil but the energy stocks have not followed the pullback
at the time of writing. These divergences could mark the bottom of this
one-month downtrend.”

“This might mark an
end to the big oil and gas companies selloff, or the rally might just
die at this trendline and start to accerate from here. It's an important place
to pay attention!”
There has been a divergence between energy stock prices and
the price of Brent crude. We track the pricing differential z-score between the
XLE ETF and Brent crude prices. This indicator tracks the 30-day price
performance of each security and compares them on a relative basis expressed as
a diversion from the mean. The XLE/crude pricing disparity currently sits below
one standard deviation from the mean. This ratio is positively correlated with
the XLE price so when it comes to depressed levels, it usually means a good
short-term buying opportunity in XLE.

Of course, a further breakdown in oil prices will impact
this trade negatively so we need to watch our stops. This article from OilPrice.com
goes on to justify the current levels of oil prices are right where they need
to be.
“WTI oil prices
plunged to almost $45 per barrel yesterday. That was a downward
adjustment to where prices should be based on supply, demand and inventory
fundamentals.”
“Analysts invent narratives to explain why things happen
after we already know the answer. In this case, oil prices fell supposedly
because of falling confidence that the OPEC production cuts are working, fears
of increasing U.S. shale output, and weakening demand from China.
None of those factors is new nor did they seem to affect the
market a few weeks ago when prices were above $53 per barrel.
The real reason that oil prices have fallen is that they
were too high and needed to adjust downward. Comparative inventory analysis
(Bodell,2009) suggests that the correct price for WTI right now is about $45
per barrel”

A few stocks we’re
looking at for this trade.

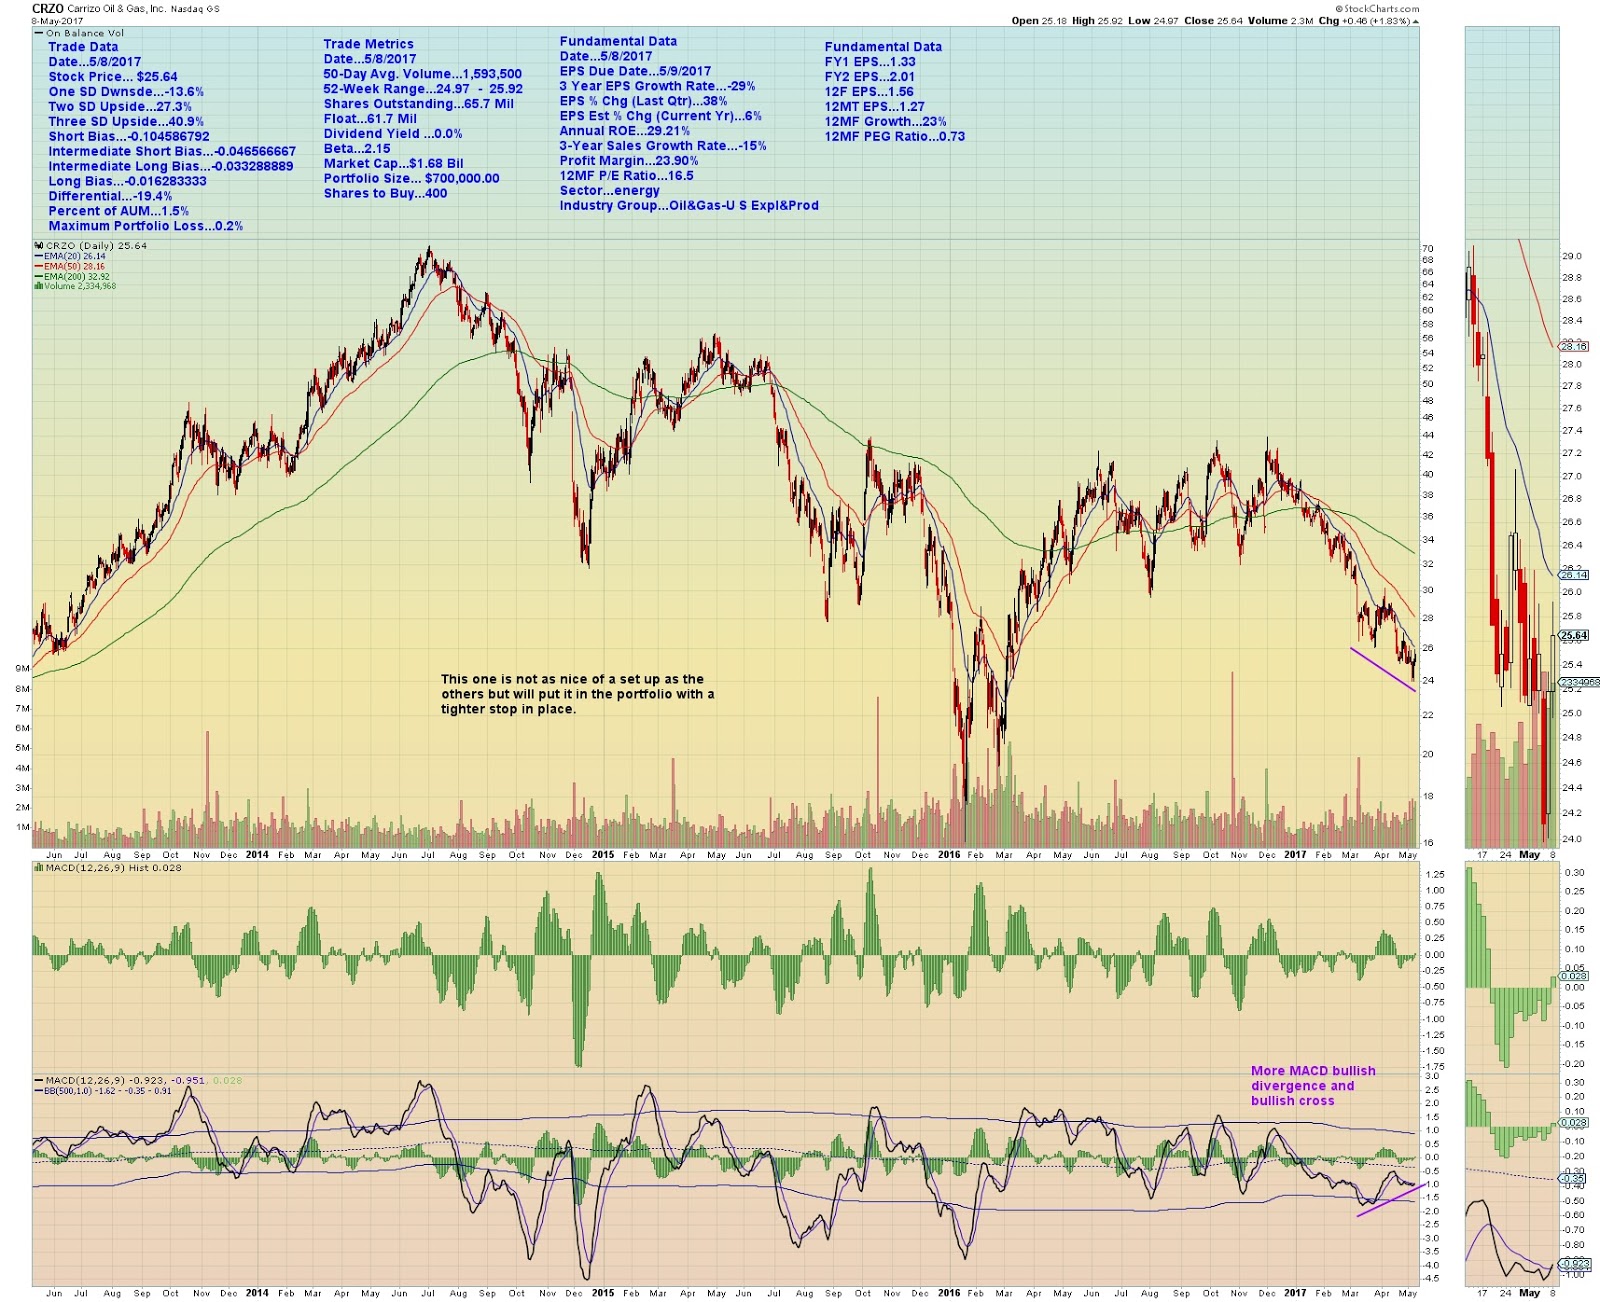

A few stocks that we
bought for this trade.


Joseph S. Kalinowski, CFA
Email: joe@squaredconcept.net
Twitter: @jskalinowski
Facebook: https://www.facebook.com/JoeKalinowskiCFA/
Blog: http://squaredconcept.blogspot.com/
Tumblr: trader-rants
No part of this report may be reproduced in any manner
without the expressed written permission of Squared Concept Asset Management,
LLC. Any information presented in this report is for informational
purposes only. All opinions expressed in this report are subject to
change without notice. Squared Concept Asset Management, LLC is a
Registered Investment Advisory and consulting company. These entities may have
had in the past or may have in the present or future long or short positions,
or own options on the companies discussed. In some cases, these positions
may have been established prior to the writing of the report.
The above information should not be construed as a
solicitation to buy or sell the securities discussed herein. The
publisher of this report cannot verify the accuracy of this information.
The owners of Squared Concept Asset Management, LLC and its affiliated
companies may also be conducting trades based on the firm’s research
ideas. They also may hold positions contrary to the ideas presented in
the research as market conditions may warrant.
This analysis should not be considered investment advice and
may not be suitable for the readers’ portfolio. This analysis has been written
without consideration to the readers’ risk and return profile nor has the
readers’ liquidity needs, time horizon, tax circumstances or unique preferences
been considered. Any purchase or sale activity in any securities or other
instrument should be based upon the readers’ own analysis and conclusions. Past
performance is not indicative of future results.
No comments:
Post a Comment