The market is still trading in a tight range. The past few
trading sessions has seen the market sell off initially but recoup most if its
losses by the close. It’s a good sign that we are not seeing heavy institutional
selling.
On the daily SPX chart, we see a symmetrical triangle has
developed signifying listless direction. A big volume break up or down may
determine the overall direction of the market through the end of the year.
We are leaning towards a break to the upside for a few
reasons.
(1)
Earnings season is beginning and the preliminary
movements in earnings estimates have been favorable as we pointed out in our
recent blog post Positioning
for 4Q16.
(2)
A December rate hike is currently reflected in
equity prices.
(3)
The Trump campaign appears to be imploding.
(4)
In most cases a symmetrical triangle breaks in
the direction of the overall trend. Since February that trend has been up.
(5)
The Nasdaq and Russell 2000 small caps are
performing better than the S&P 500 and are leading the overall market trend
higher (meaning they are or are close to holding their 20DMA.)
We have deployed some cash in the portfolio but will get
more aggressive should we break to the upside. If we are wrong on our analysis,
we will pull positions off and await a better entry.
Consumer Staples
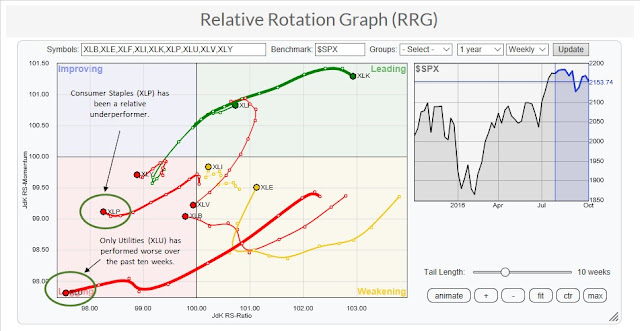
The consumer staples sector has been taking a beating. Over
the past ten weeks only utilities have performed worse relative to the S&P
500.
We consider this a buying opportunity and are going to take
a position in the consumer staples sector for several reasons.
The fundamental picture has been steadily improving since
the end of 1Q16 as seen by the EPS, book value and cash flow trends.
Both earnings and book value per share have a meaningful
impact on sector valuation. With twelve month eps forecasts around $27.43 and trailing
twelve-month book value per share near $101.66 for the sector, we estimate the
sector to be 10% to 15% undervalued.
Our value variance measure that examines the distance
between current index prices and perceived fair value is over two standard
deviations from the mean. That has represented great entry points for
opportunistic trading scenarios in the past.
We also track the rate of change of the value variance to
determine the magnitude of the sell-off. This acts as a confirmation of the
value variance measure. The chart below highlights the confirmation pattern of
the value variance buy signals.
While the fundamental screening process is giving us a buy
signal, the technical picture looks a bit rough but one can determine key
levels of support that may confirm our investment thesis. On the daily consumer
discretionary the index is sitting on the 200DMA that has held as the final front
of support on several occasions. We are also seeing a potential bullish
divergence between pricing and RSI and MACD. The volume momentum and breadth
momentum indicators are also showing waning negative deterioration and a
possible bullish divergence.
On the weekly consumer staples chart the uptrend remains in
place and the index is sitting near the 50WMA which has acted as support in the
past. RSI (14) remains at or near the 50 level and given the improving
fundamental picture there isn’t any reason to believe that these previous
support levels will fail.
Happy Trading!
Joseph S. Kalinowski, CFA
Email: joe@squaredconcept.net
Twitter: @jskalinowski
Facebook: https://www.facebook.com/JoeKalinowskiCFA/
Blog: http://squaredconcept.blogspot.com/
Web Site: http://www.squaredconcept.net/
No part of this report may be reproduced in any manner
without the expressed written permission of Squared Concept Asset Management,
LLC. Any information presented in this report is for informational
purposes only. All opinions expressed in this report are subject to
change without notice. Squared Concept Asset Management, LLC is a
Registered Investment Advisory and consulting company. These entities may have
had in the past or may have in the present or future long or short positions,
or own options on the companies discussed. In some cases, these positions
may have been established prior to the writing of the particular report.
The above information should not be construed as a
solicitation to buy or sell the securities discussed herein. The
publisher of this report cannot verify the accuracy of this information.
The owners of Squared Concept Asset Management, LLC and its affiliated
companies may also be conducting trades based on the firm’s research
ideas. They also may hold positions contrary to the ideas presented in
the research as market conditions may warrant.
This analysis should not be considered investment advice and
may not be suitable for the readers’ portfolio. This analysis has been written
without consideration to the readers’ risk and return profile nor has the
readers’ liquidity needs, time horizon, tax circumstances or unique preferences
been taken into account. Any purchase or sale activity in any securities or
other instrument should be based upon the readers’ own analysis and
conclusions. Past performance is not indicative of future results.


No comments:
Post a Comment