
“The CBOE SKEW Index
("SKEW") is an index derived from the price of S&P 500 tail risk.
Similar to VIX®, the price of S&P 500 tail risk is calculated from the
prices of S&P 500 out-of-the-money options. SKEW typically ranges from 100 to
150. A SKEW value of 100 means that the perceived distribution of S&P 500
log-returns is normal, and the probability of outlier returns is therefore
negligible. As SKEW rises above 100, the left tail of the S&P 500
distribution acquires more weight, and the probabilities of outlier returns
become more significant. One can estimate these probabilities from the value of
SKEW. Since an increase in perceived tail risk increases the relative demand
for low strike puts, increases in SKEW also correspond to an overall steepening
of the curve of implied volatilities, familiar to option traders as the
"skew".” https://www.cboe.com/products/vix-index-volatility/volatility-indicators/skew
The CBOE SKEW Index has been rising over the past several
months and closed Friday at 131.39. This increase in perceived tail risk has
fallen very dramatically from the peaks of several weeks/months ago. We track
the MACD (20,50,10) on the SKEW and overlay the Bollinger Band with a (200,1)
setting. What we find is that the market (S&P 500) outperforms
significantly in the several weeks and months following a drop below one and
two standard deviations from the mean.

We examined the SKEW Index back to 1990 and found that when
the SKEW MACD (20,50,10) drops below one standard deviation from the mean (as
it is today) the S&P 500 has shown better than average performance.
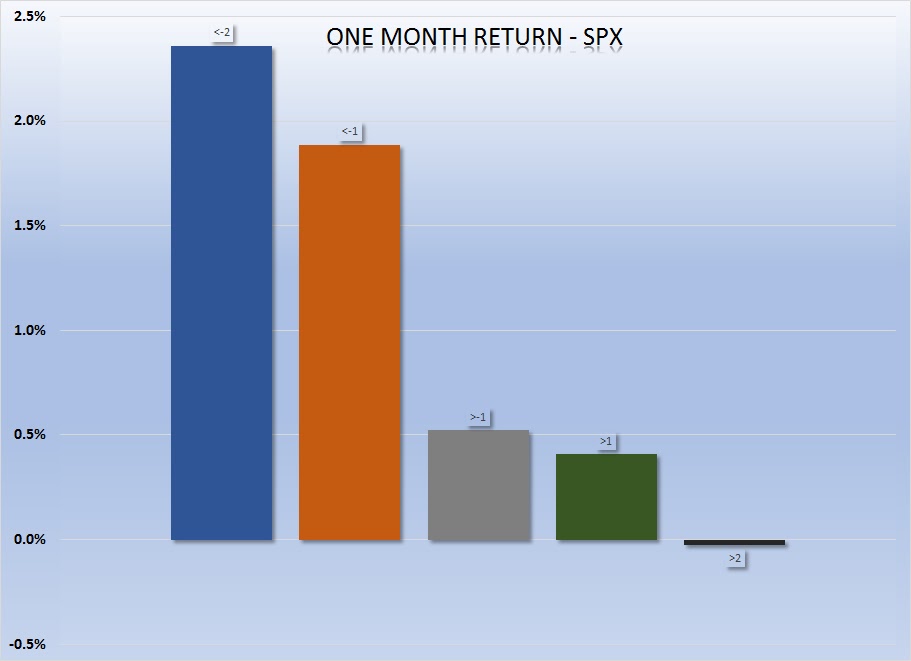
Let’s start with the expected one-month SPX performance when
the model sits below one standard deviation. Out of 6619 observations this
event has occurred 1197 times or only 18% of the time since 1990. When the
model has dropped below one standard deviation the average one-month return for
the S&P 500 has been 1.9% compared to only 0.5% in the occurrences when the
model was above one standard deviation. In the occurrences when the model was
below one standard deviation the market went on to be higher 70.5% of the time
compared to just 61.0% of the time when the model was above one standard
deviation.
If we come across the very rare occurrence when the model
drops below two standard deviation (this only happened 175 times out of 6619
observations or 2.6% of the time) the forward one-month returns were even more pronounced.
At minus two standard deviations, the S&P 500 was up on average 2.4% in the
next month and was up 76.0% of the time.
Compare this to when the model is over one standard
deviation. The average one-month return is just 0.4% on average and up only 61.4%
of the time. When the model is above two standard deviations (this only
happened 4% of the time since 1990) the average one-month return is 0.0% and is
up 58.8% of the time.
The chart below shows the average one-month return of the
SPX at different model intervals.
The two month return for the SPX are equally impactful when
the model reaches its outlier levels.
At minus one standard deviation the average two-month return
is 2.5% and up 70.8% of the time as opposed to just 1.2% and 64.3%,
respectively when the model is above minus one standard deviation.
At minus two standard deviations the SPX averages 3.3% over
two months and is up 77.7% of the time.

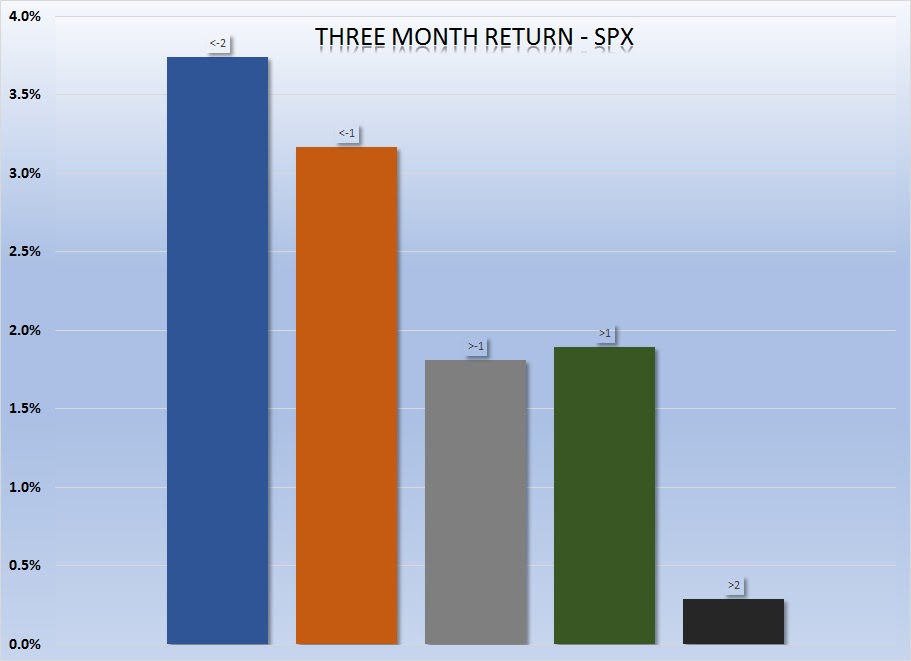
We have conducted this study using three and six months
returns as well and the results are still impressive, although it seems the
greatest returns come in within the first two months. We have attached the
following charts to show the three and six months returns as well as a graphic
for review.


Bottom Line: Using
the SKEW Index is one of many tools used to determine our tactical strategy and
portfolio hedging decisions. Based on the historical data used here, it would
indicate that the market will continue its upward trend as it strives for ever
new highs.
Joseph S. Kalinowski, CFA
Twitter: @jskalinowski
Facebook: https://www.facebook.com/JoeKalinowskiCFA/
Blog: http://squaredconcept.blogspot.com/
Tumblr: trader-rants
The above information should not be construed as a solicitation to buy or sell the securities discussed herein. The publisher of this report cannot verify the accuracy of this information. The owners of Squared Concept Asset Management, LLC and its affiliated companies may also be conducting trades based on the firm’s research ideas. They also may hold positions contrary to the ideas presented in the research as market conditions may warrant.
This analysis should not be considered investment advice and may not be suitable for the readers’ portfolio. This analysis has been written without consideration to the readers’ risk and return profile nor has the readers’ liquidity needs, time horizon, tax circumstances or unique preferences been considered. Any purchase or sale activity in any securities or other instrument should be based upon the readers’ own analysis and conclusions. Past performance is not indicative of future results.
No comments:
Post a Comment